“Growth at all costs” has been the mantra for startups and large businesses alike for many years, but this strategy is quickly waning. Now, companies must focus on growing efficiently. And one of the keys to efficient growth is retaining the customers you already have.
When it comes to customer health, teams need to shift from being reactive to proactive—which all starts with data. With product analytics, you can easily see how often users return to your product and which features they engage with—two signals of whether or not they are getting value. If users aren’t finding your product valuable, they’re at risk of abandoning it altogether and, eventually, churning.
At a high level, here are some metrics in Pendo that will help you keep a pulse on the health of your users and customers:
-
- Logins: See the number of logins across all users for a given account, over a given time period, e.g. within the last 30 days
- Active users: See the number of active users for a given account, over a given time period, e.g. within the last 30 days
- Days active, Time on site, and Usage trending: Pull these metrics into a report (at the visitor or account level) to quickly identify accounts that are trending towards risk
- Stickiness Widget: Track the ratio of average daily or weekly active users to average weekly or monthly active users, in a given time period
In addition to consistently tracking usage metrics like those listed above, let’s dig into three ways you can use Pendo to take a proactive approach to measuring—and improving—customer health.
1. Product Engagement Score (PES)
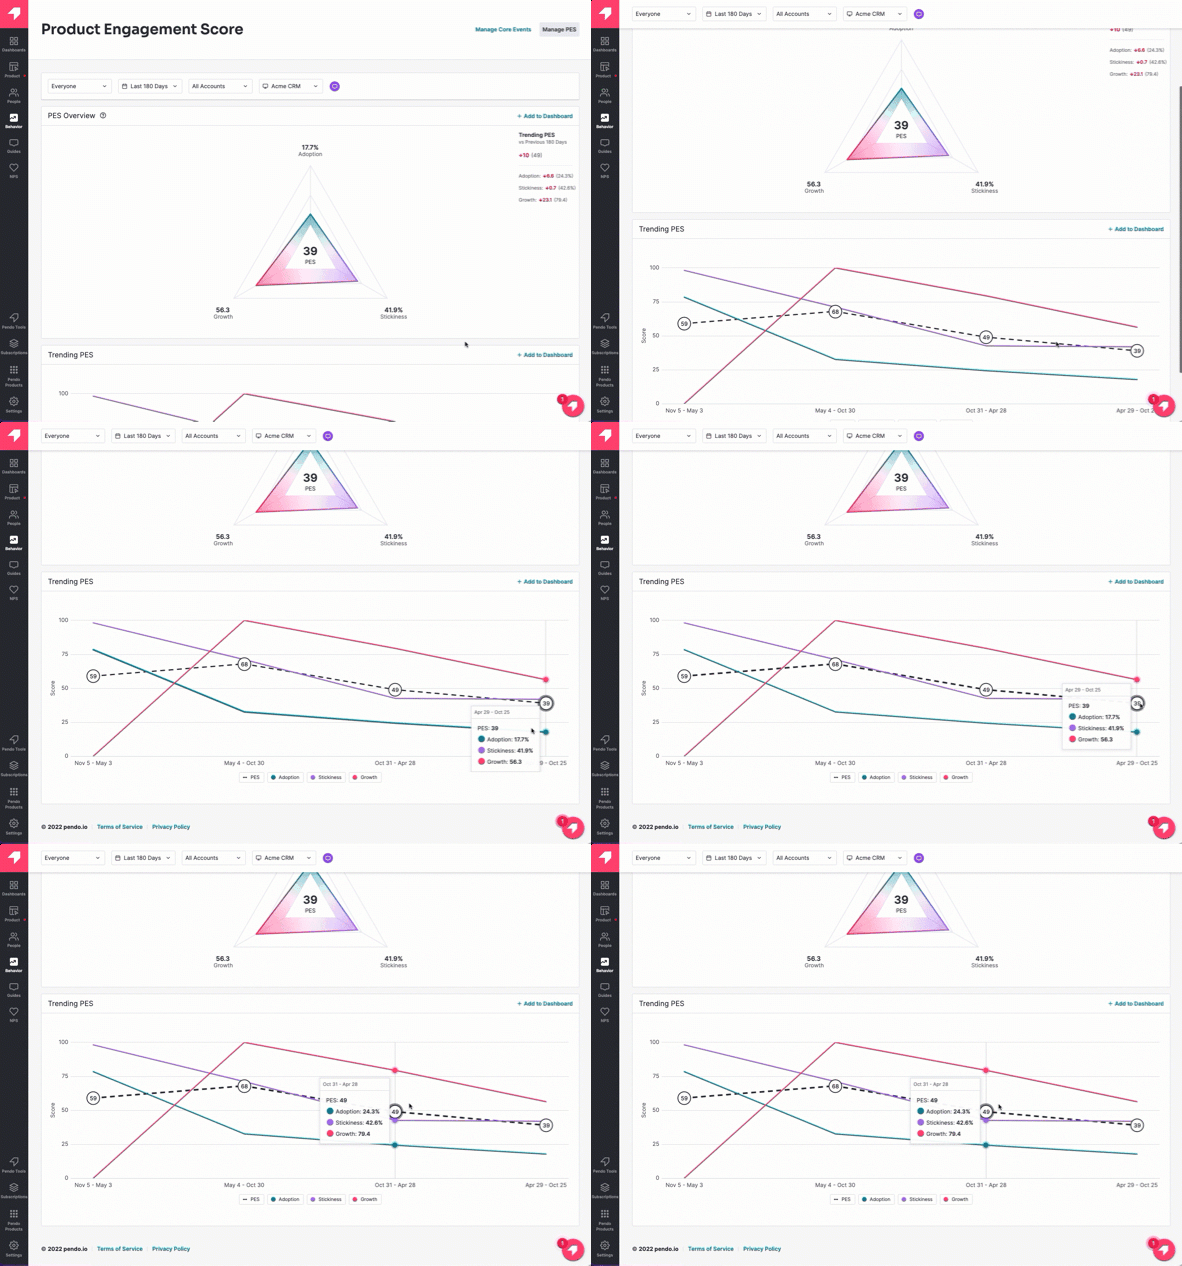
The Product Engagement Score (PES) is a composite metric in Pendo that allows you to measure user engagement with a single number. It’s made up of three components (adoption, stickiness, and growth), so teams can both understand engagement at a high level and dig into the individual metrics contributing to engagement.
In addition to continuously tracking PES and identifying opportunities to improve user engagement, you can also use it to predict—and prevent—churn. After analyzing Product Engagement Score and contract renewal data, Pendo’s data science team found that PES is correlated with customer retention. In the months leading up to a renewal decision, the accounts with the highest PES were the most likely to renew and expand, those with slightly lower PES were likely to renew flat, and those with the lowest PES correlated with churn.
Knowing this, you can use Product Engagement Score as a leading indicator for customer health. If you see a decrease in your PES, dig into each of its three components to see which metric (or metrics) is bringing down the average.

From there, you can use Pendo’s in-app guides to drive positive user behaviors and demonstrate your product’s value. For example:
-
- Create in-app walkthroughs and tooltips to increase discovery and usage of your product’s most important features.
- Identify the features that are used by those who access your product most frequently. Then, build in-app campaigns to steer other users to those areas of your product.
- Use the Pendo Resource Center to create an always-on hub for product walkthroughs, help center articles, and documentation that users can access at any time.
2. Retention
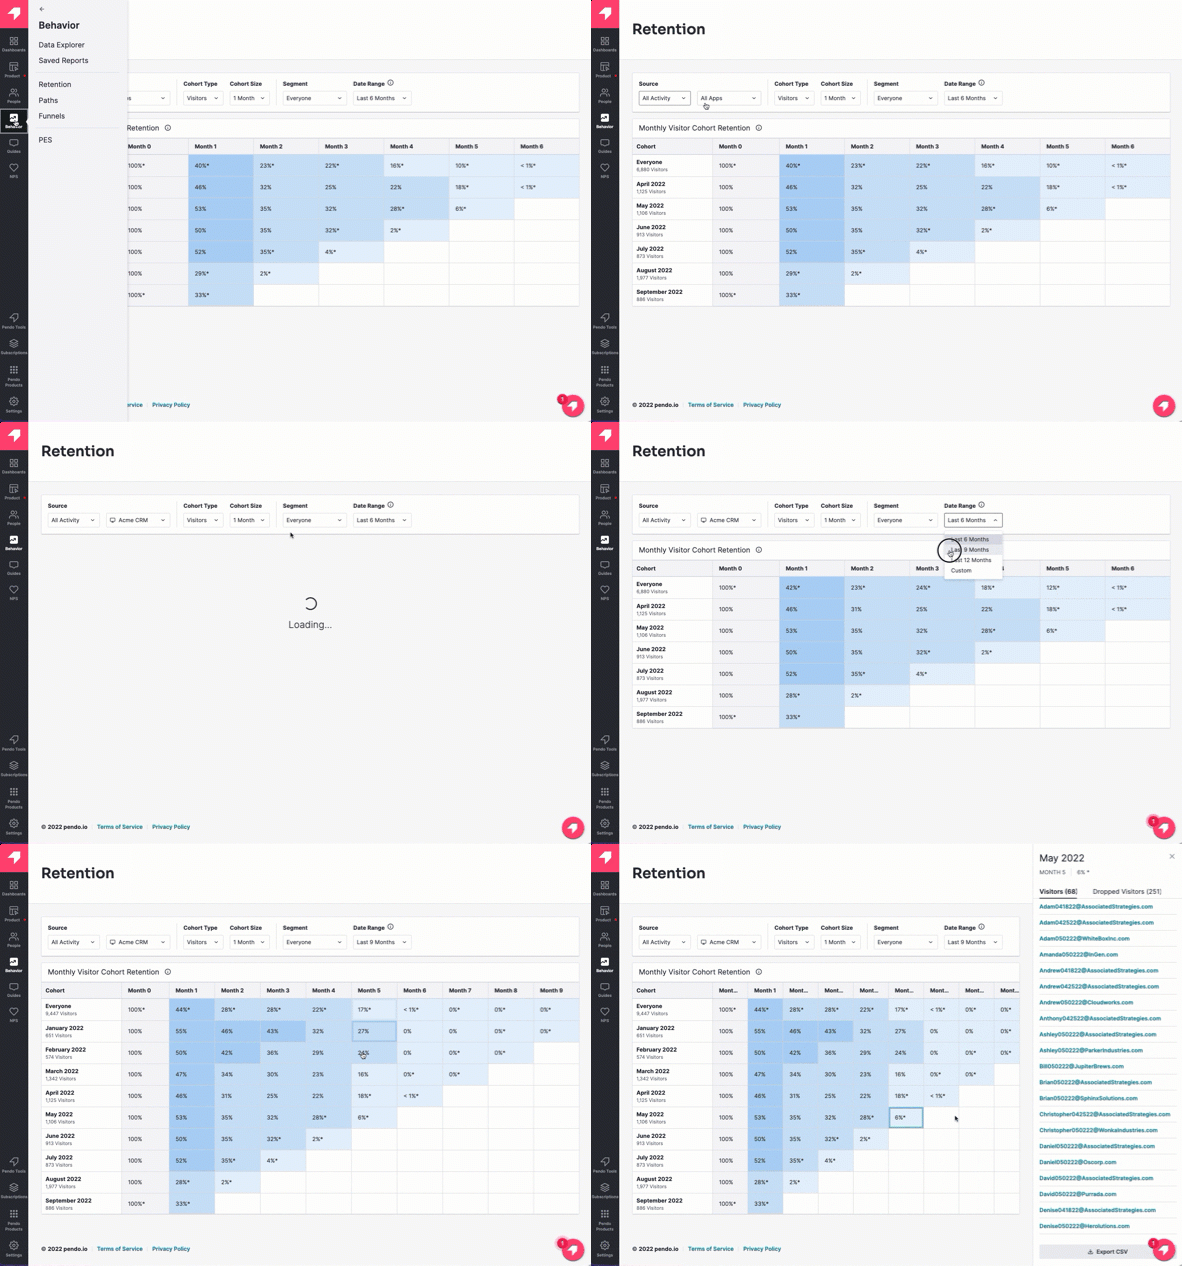
User retention looks at first time users within a specific timeframe (typically one month or one week) and calculates the percentage of those users that return in subsequent time periods. This helps you understand if customers are seeing value in your product—if they don’t keep logging in, they’re likely not finding your product valuable. You can also segment retention data to understand how it differs for various subsets of your user base, for example users with different job titles.
In Pendo, you can easily view retention data in a few simple steps:
-
- Click Behavior, then Retention
- Choose “All Activity” as the source
- Select the rest of your preferences: application, cohort type and size, segment, and date range
- Click the box where retention starts to fall to see the list of visitors who “dropped”

If you see retention for a cohort decreased significantly (e.g. half as many visitors or accounts retained than the previous month), it’s time to start planning your intervention. If you’re able to steer these users back on track now, it can help prevent churn down the line. Download a CSV of the users in this cohort and use it to create a segment for these specific users. Then, use the segment to dig further into their in-app behavior: Are there certain workflows or steps where they’re getting stuck? Are they accessing your product’s key features? You can also use the segment to target these users with in-app walkthroughs and tutorials to ensure they’re getting the most out of your product.
3. High-value feature usage
Every product has features that are the most important—and critical to customers realizing value and continuing to use the application over time. For example, for a business expense reporting tool, one of these features is likely the “Create report” button.
If users aren’t engaging with your product’s high-value features, it’s an indication they aren’t getting value, and could be an early indication of future churn. One way to view this data in Pendo is by using an Account Report. Here are some steps to get started:
-
- On the left sidebar, navigate to People and then to Accounts
- Click into the Account Reports tab and then on the Create Report button
- Create a report and select the appropriate segment—for example, you might want to only look at data for your Enterprise accounts
- Add columns to your report, including Feature Use for high-value features, Guide Views, and Poll Responses
- Use the report to see which accounts are accessing your core features and if they’re engaging with relevant in-app guides and polls
If you see that users aren’t engaging with certain key features, start asking questions to understand the “why” behind this behavior. Do you have an onboarding experience that introduces these features to users early in their journey? Are these features complex, and therefore could benefit from additional in-app context and education? Reevaluate your in-app experience—especially for new users—and use Pendo guides to ensure users have the tools and information they need to be successful in your product.
Looking for more ways to leverage Pendo data to better understand (and support) your users? Learn 10 questions you can answer with Pendo data.

