Table of Contents
What is mobile analytics?
Mobile analytics is a form of product analytics. This type of business intelligence software captures and exposes user behaviors and patterns within mobile applications through page and feature tagging. This data informs decisions about how to improve the mobile product experience, increase mobile app engagement, and drive business outcomes.
Benefits of using mobile analytics software
Mobile analytics data can help product managers (PMs) effectively track mobile user engagement and satisfaction—and measure it over time. For example, mobile analytics can help you understand:
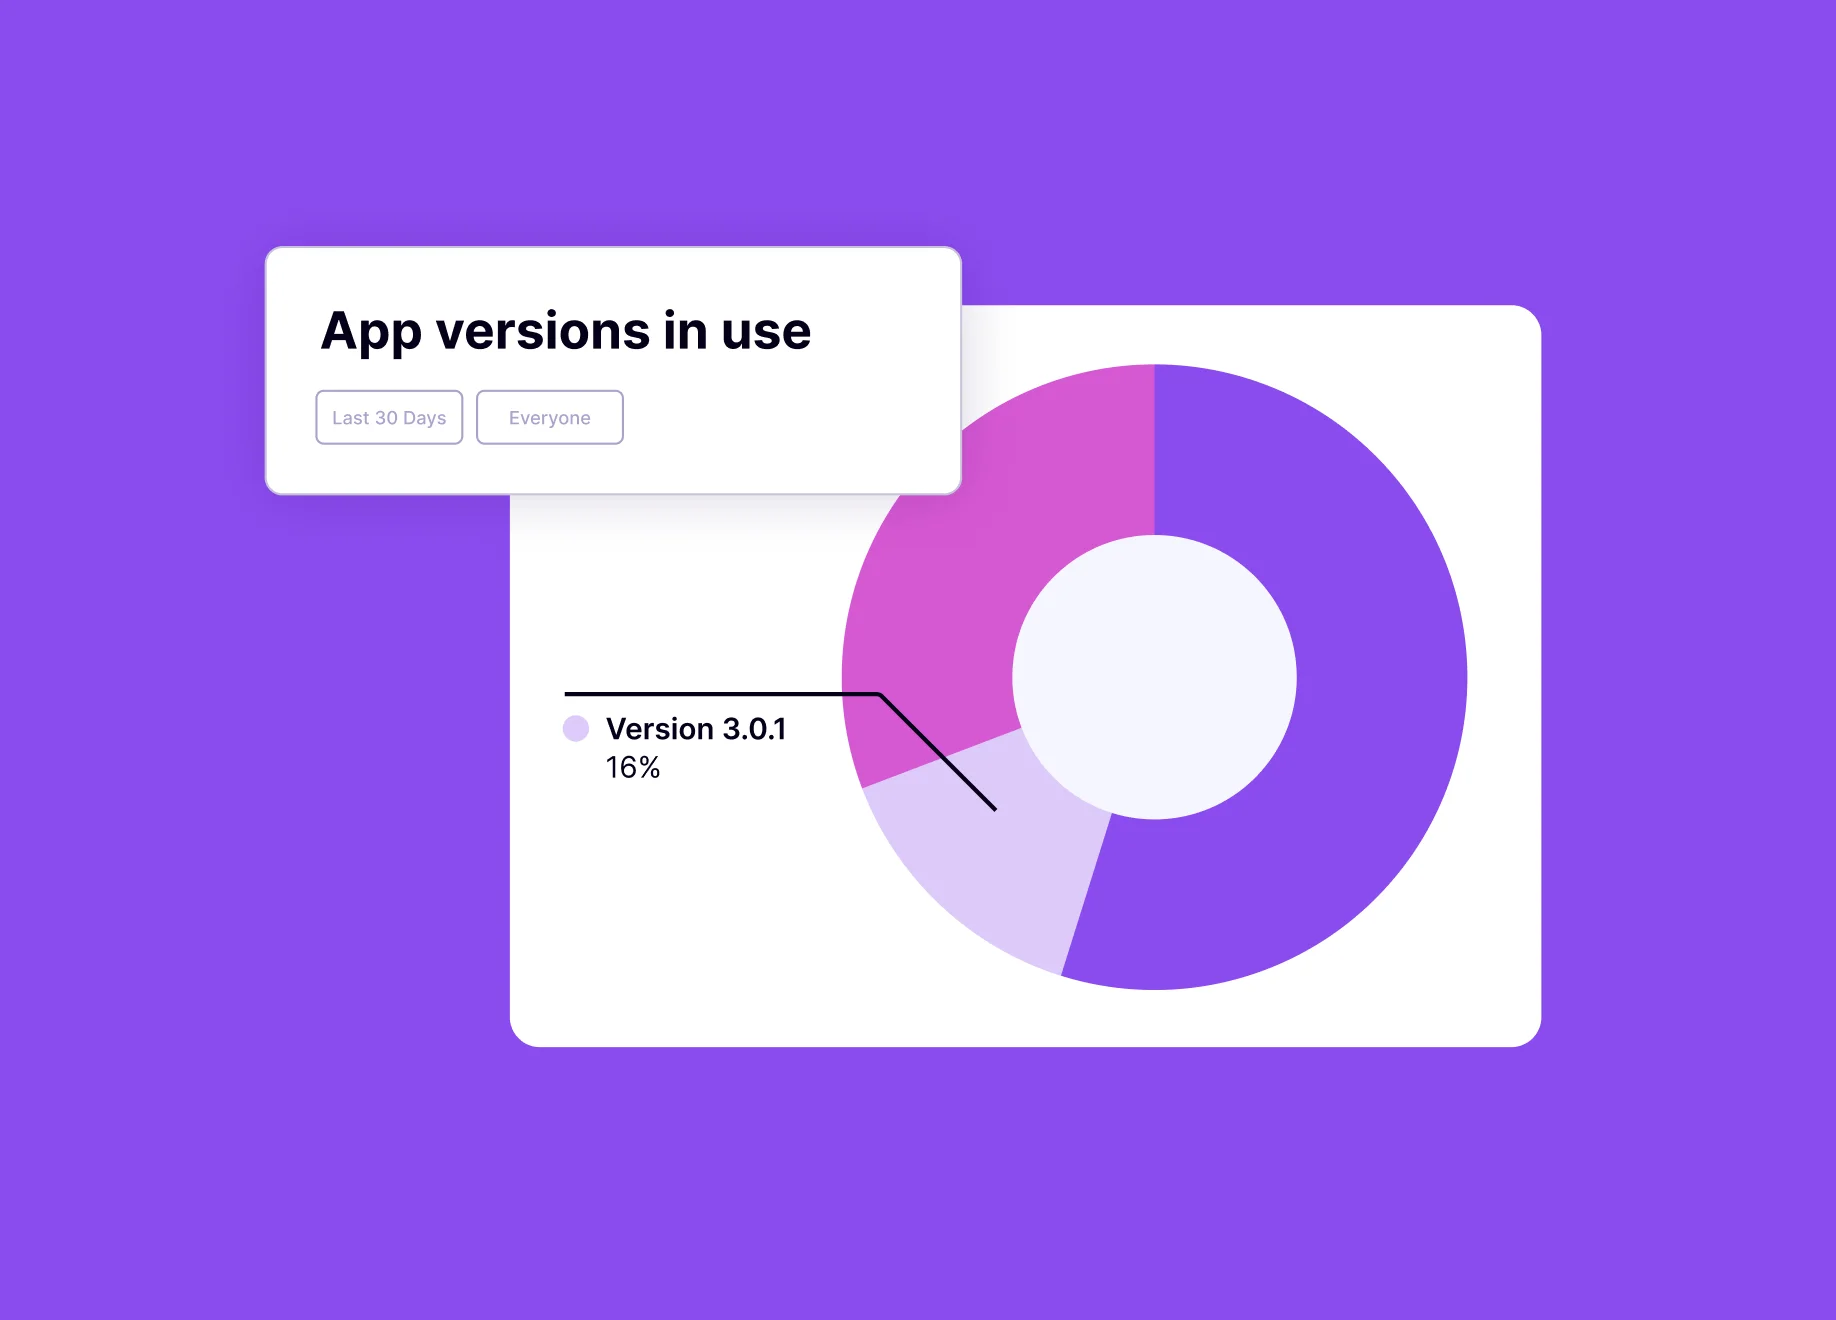
- App versions: Who’s using which version of your app?
- Users on an old app version may be experiencing issues you’ve already fixed in a more recent release—bogging your team down with support tickets and requests to solve issues that have already been addressed. Mobile analytics can help you identify how many users are still holding out and using old app versions so you can understand the scope and urgency of pushing them to your latest version, then take the appropriate action within your app.
- Retention rate: How many users are in it for the long haul?
- Retention rate is the percentage of users still using your app after they initially install or start using it. Understanding how long users are sticking with your app and where usage is dropping off can be a valuable step in understanding—and ultimately optimizing—the entire user journey. While it’s typical for retention rates to taper off following the initial launch or onboarding period, dramatic drop-offs could point to larger issues that may be worth addressing.
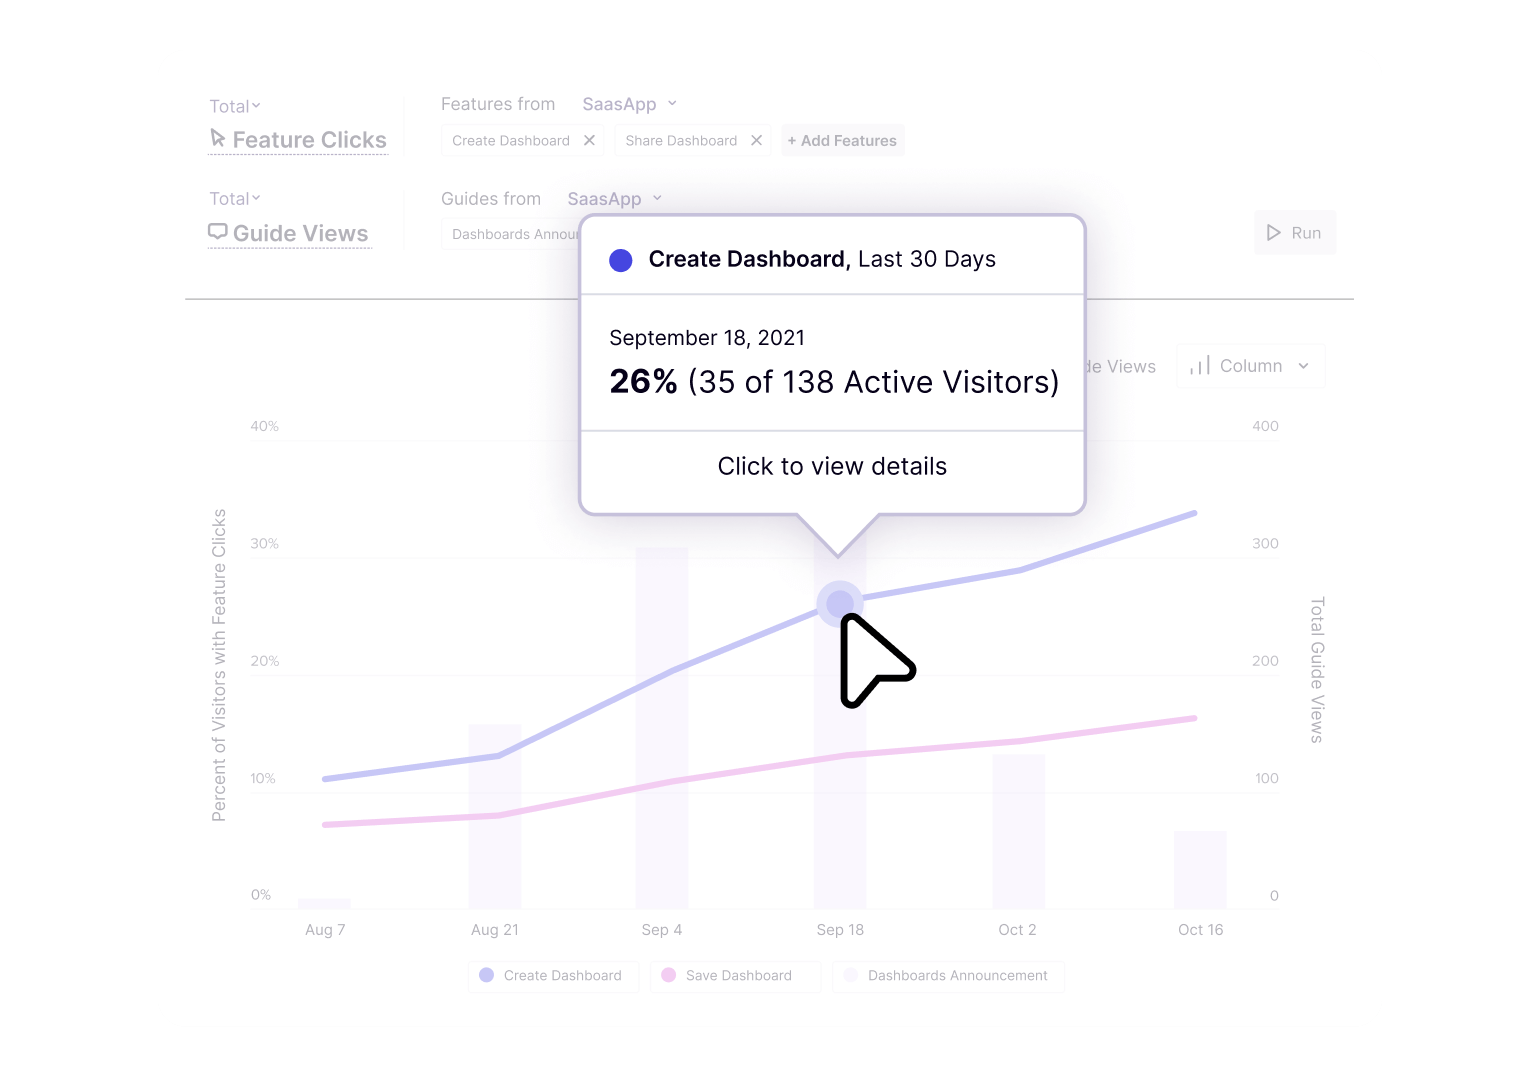
- Feature adoption: How are users engaging with mobile app features?
- Feature adoption is a great indicator of how well new app features are being received—and if users are finding value in them (and thus incorporating them into their day-to-day). Tagging specific features in your mobile app allows you to understand how frequently a specific area or function within your app is being used, and by whom.
- Core Events: Are users getting value from your mobile app?
- Tagging the most important features, pages, and track events in your mobile app helps you assess whether users are utilizing your product as intended. In Pendo, these tagged elements and actions are called Core Events. A Core Event is what a user does when they’re demonstrating meaningful use of your app—in other words, using a feature that helps them realize the full value of your product and keeps them coming back.
- Page tags: How are users moving through your mobile app?
- Tagging mobile pages helps you understand the flow and behaviors of your mobile app users. By understanding the pages they visit—and the actions they take on each page—you can identify opportunities to streamline their workflows, simplify navigation, or build in moments of delight to enhance their journey.
For more information on the KPIs a mobile analytics tool could help you measure, check out this e-book on the top 10 mobile KPIs you should be tracking (and why).
Why are mobile analytics tools important?
Today, users expect software that is seamless, intuitive, and delightful—whether they’re at home or at work, on web or on mobile. And in the era of multi-screen and multi-session product experiences, a mobile-first mindset—informed by an understanding of how your users behave in both your web-based and mobile products (and how they move between them)—is critical for optimizing engagement. Mobile analytics provides a foundational layer of data that companies can use to measure and improve their mobile users’ experience.
How are mobile app analytics used?
For many teams, the decision to incorporate mobile app analytics into the tech stack begins with asking questions. For example:
- Which features of my mobile app are delivering the most value to users?
- How are users moving through and navigating the app?
- What is the potential impact of sunsetting this old app version?
- How many users do I need to communicate a version update to?
- At what stage of the journey are users dropping off or getting stuck?
With mobile analytics tools, PMs can see the full user journey and identify opportunities to improve how their product drives it. These tools also help PMs correlate mobile app analytics to operational metrics so they can gain a clear view of how specific mobile features influence business results—like increased productivity, fewer support tickets or calls, and higher user satisfaction.
A platform like Pendo, which combines both mobile analytics and in-app engagement tools (including guides and polls) is ideal for PMs who are looking to understand—and then take action on—user behaviors across sessions and devices.
For example, say you’re preparing to sunset an old version of your app, but first need to understand the impact it might have—and create a strategy for communicating the change to users. Pendo for Mobile’s analytics can help you identify which users are still using the old app version, then segment and target them with in-app messaging that alerts them of the upcoming sunset and directs them to the appropriate app store. When those users update and open the latest version of the app, you can then serve them a customized onboarding walkthrough that introduces any new benefits and features they may not have used or had access to in the older app version.
How mobile analytics helps product teams make data-driven decisions
Mobile analytics isn’t just about collecting data—it’s about turning that data into actionable insights that shape your product strategy, improve user experience (UX), and drive growth. Here’s how product teams use mobile analytics to make smarter decisions:
Identify which features drive retention
By tracking in-app behavior, teams can pinpoint which features are most used by retained users. For example, if 80% of users who engage with a social sharing feature return within 7 days, that’s a signal it’s creating sticky behaviors. These insights help teams double down on what’s working and promote those features more strategically.
Prioritize the roadmap based on behavioral insights
It’s easy to make assumptions about what users want—but mobile analytics provides concrete evidence. If certain features see low usage, they may need rethinking or removal. Conversely, high-traffic features can indicate what’s adding value, and where to invest further. Usage heatmaps, event tracking, and paths/funnels that demonstrate user flows can all help drive roadmap decisions rooted in real-world behavior.
Spot friction and optimize user onboarding
The first few minutes of app usage are critical. Analytics can show exactly where users are abandoning the onboarding process. Are they dropping off during sign-up? Skipping a tutorial? Failing to enable permissions? These insights allow product teams to A/B test onboarding flows, simplify friction points, and improve first impressions—leading to better activation rates.
Detect app crashes & bugs faster
Analytics platforms often include performance monitoring and crash reporting. Real-time alerts and crash logs help product and engineering teams identify bugs early and fix them before they affect a wider user base. Reducing bugs not only protects your reputation—it directly improves user satisfaction and retention.
What mobile analytics should I track?
Tracking the right metrics is essential for understanding how users engage with your mobile app, identifying opportunities for optimization, and making data-driven product decisions. Here are some of the most valuable mobile analytics metrics and why they matter:
DAU/MAU (Daily Active Users / Monthly Active Users)
Why it matters: These metrics reveal how many users are returning to your app on a daily or monthly basis. A healthy DAU/MAU ratio indicates strong user stickiness and product-market fit.
Retention rate
Why it matters: Retention shows how well your app keeps users coming back after their first visit. High retention means users find value in your product, while low retention could point to poor onboarding or lackluster feature engagement.
Session length & frequency
Why it matters: These tell you how long users stay in your app and how often they come back. Short, infrequent sessions might suggest your app isn’t meeting user needs or is difficult to navigate.
Funnels & user flows
Why it matters: Funnels help you see where users drop off during key workflows like onboarding, checkout, or registration. Mapping these flows lets you identify friction points and optimize the in-app experience.
Crash reports & performance
Why it matters: A slow or buggy app leads to churn. Tracking crashes and performance issues helps you prioritize technical fixes and protect the user experience.
In-app events (e.g. button taps, screen views)
Why it matters: Event tracking gives you a fine-grained look at how users interact with features. This data is key to understanding user intent and uncovering which actions lead to conversions or drop-offs.
💡 Pro tip: Tracking in-app events gives you visibility into user intent and behavior beyond just pageviews.
Attribution sources
Why it matters: Attribution tells you where your users are coming from—paid ads, organic search, app store, etc. This helps you understand ROI on acquisition efforts and which sources bring in the most valuable users.
Mobile analytics vs. web analytics: Understanding the key differences
Both mobile and web analytics provide crucial insights into user behavior and application performance. However, they cater to fundamentally different environments and user interactions.
What is the purpose of mobile analytics
Mobile analytics focuses on tracking interactions within mobile apps, capturing data unique to mobile devices such as app crashes, push-notification interactions, and session frequency. Tracking mobile-specific data is essential, as mobile users often engage with content differently due to the portable nature of devices and touch-based interactions.
How web analytics are different
In contrast, web analytics primarily deals with tracking user behavior on websites accessed through web browsers on desktops or mobile devices. This includes metrics such as page views, user flow, bounce rates, and time spent on pages. The technology used here relies heavily on cookies and URL tracking to provide insights into how users navigate and interact with web pages.
The clear difference between mobile app analytics and web analytics
The primary distinction between mobile and web analytics lies in the type of data collected and how it is used to optimize user experiences. Mobile analytics is indispensable for apps intended for frequent, on-the-go access, requiring an understanding of offline data syncing and user engagement in different contexts. Web analytics, meanwhile, provides broader insights into content effectiveness and user retention strategies for more static, information-driven interactions.
Understanding these differences can help businesses tailor their digital strategies effectively, ensuring they meet user expectations and improve engagement across all platforms and devices.
Where can I learn more about mobile analytics?
If you’re looking to dig deeper into mobile analytics, check out these Pendo resources:
- Self-guided tour: See how analytics helps you understand the user journey
- E-book: Uncover the top 10 mobile KPIs you should be tracking (and why)
- E-book: Learn how an analytics-led approach helps drive digital adoption
How to bring product-led principles to your mobile app experience
You might also like
The essential guide to mobile app onboarding: Best practices and use cases