For the past three years, our colleagues at Pendo have surveyed hundreds of product leaders about their role and responsibilities, then compiled their responses into the annual The State of Product Leadership (SOPL) report. Last month, Pendo published their latest edition of SOPL, and as always, the findings were intriguing. However, they became even more so when compared to those reported in the 2018 and 2017 versions.
The field of product management has changed tremendously over the course of three years, and reading through the past three SOPL reports shows that in dramatic detail. These are the biggest areas of change in the product management field over the last three years.
Reporting lines
One of the questions asked in each SOPL survey was “Where does your product team report?” Here’s how the results shook out in the inaugural 2017 edition of the survey:
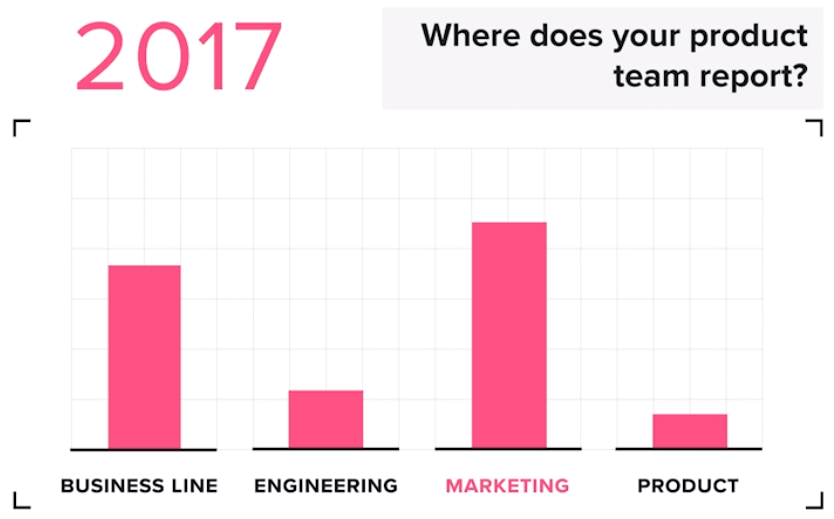
Three years ago, product teams were most likely to report up to marketing, followed by an individual line of business. The least likely reporting line? Product. Honestly, this isn’t too surprising. Even as recently as 2017, product wasn’t as influential or well-known as a function as it is today. And the chief product officer (CPO) position was relatively rare.
In 2018, however, the tide began to turn.
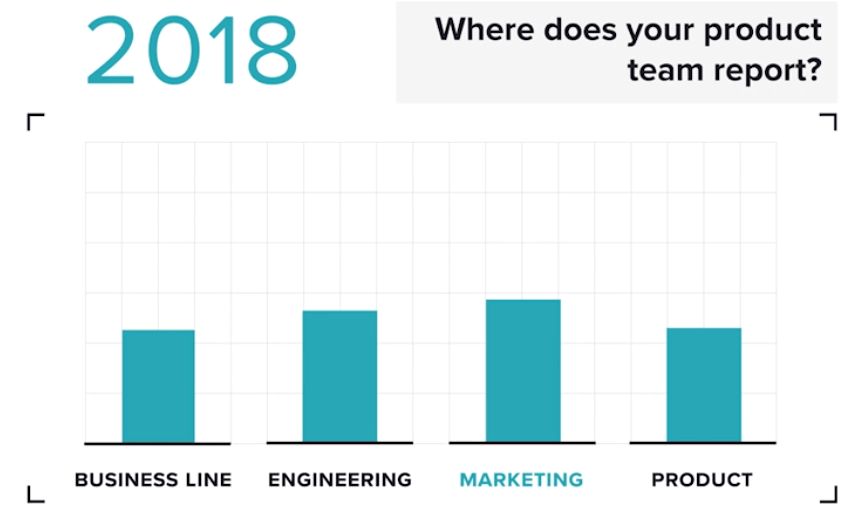
Marketing was still the most likely reporting line for product teams, but by a much smaller margin. And suddenly, product was a real contender, beating out individual line of business.
Let’s see how these numbers changed in the 2019 edition.
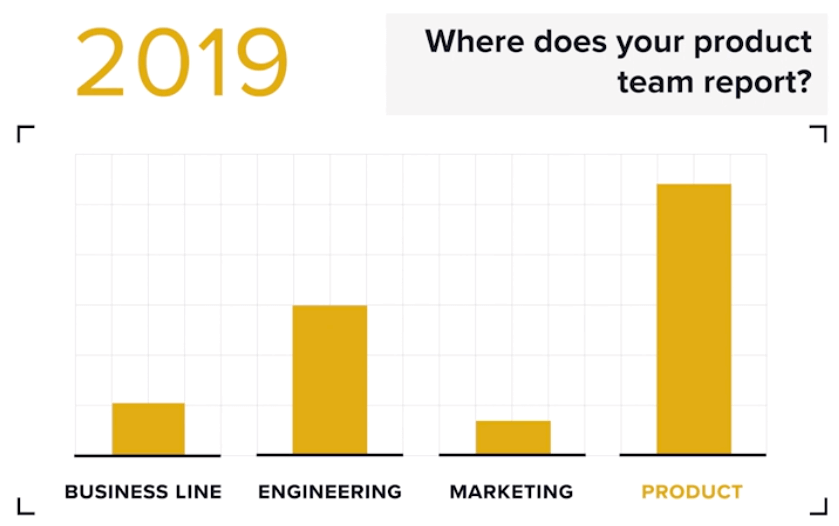
At this point, product was the most likely reporting line by far. And marketing, the strong leader in 2017, was now the least likely. What a difference just a few years makes. We’re curious to see how next year’s numbers will shake out. Will product’s lead become even more commanding? We definitely think so. Will marketing and business line disappear from this list entirely? Will yet another reporting line come out of the woodwork? Only time will tell.
Measures of success
The past three SOPL reports have shown the evolution of what product considers to be its “north star.” In 2017, revenue was at the top of the rankings:
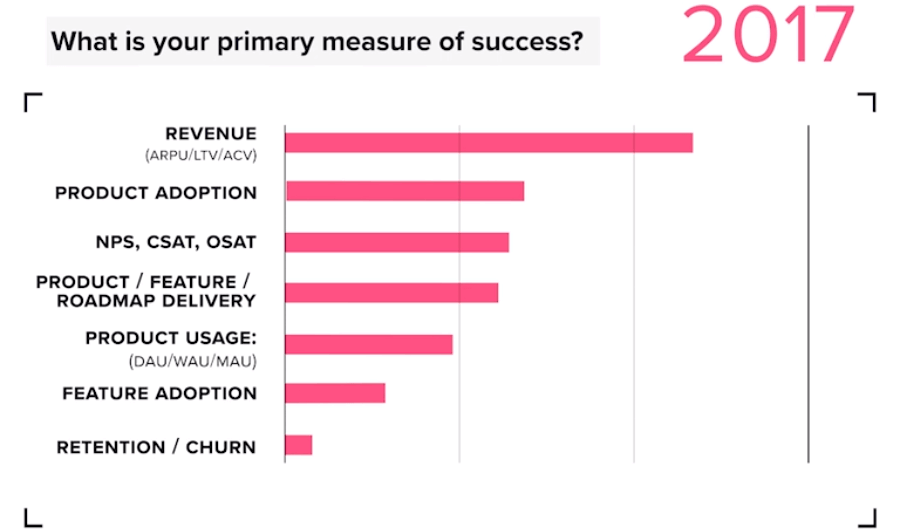
At this point in time, product was most likely to report to marketing or to an individual line of business, so it’s not all that surprising that revenue would be their topline metric.
Here are the rankings in 2018:
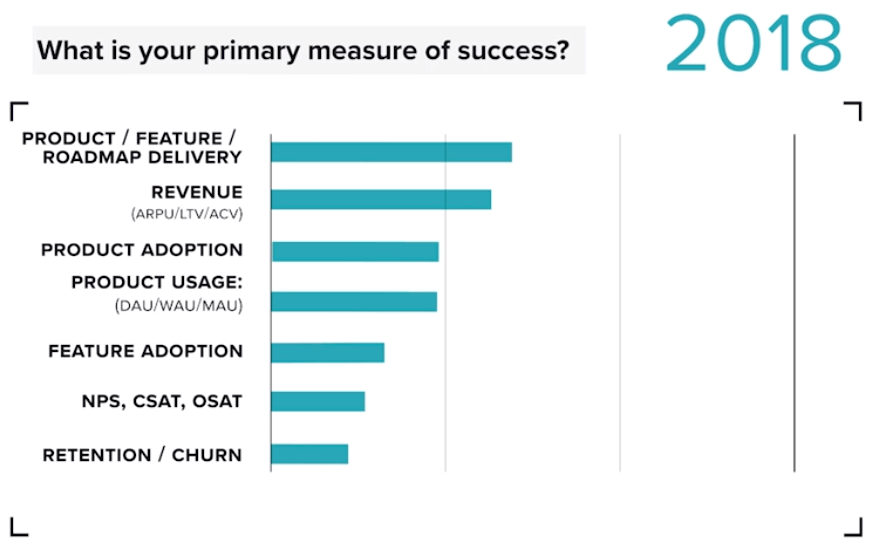
Revenue has moved into second place, and feature/roadmap delivery took the lead. We’ll admit that this finding gave us pause last year, making us worry that product teams were starting to focus on the wrong thing. However, we breathed a sigh of relief when we saw this year’s results:
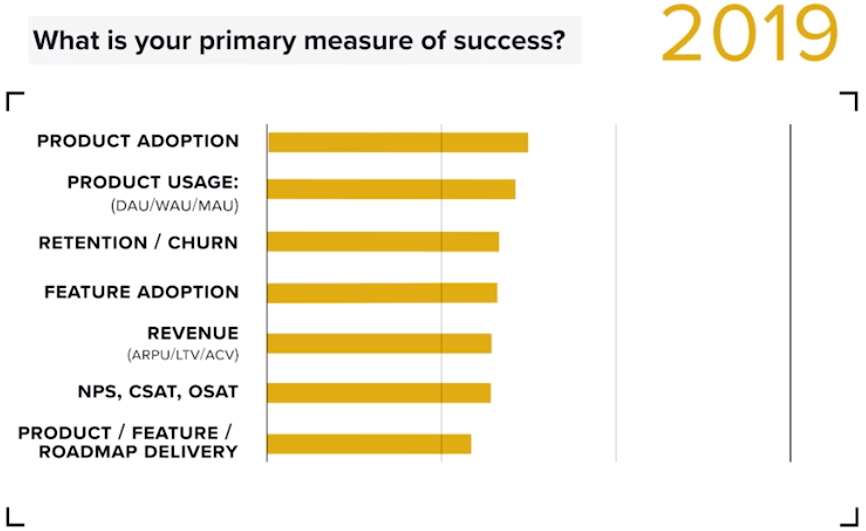
This past year, product adoption took the first-place spot as the product team’s north star metric, followed closely by product usage. This is what we like to see! In just one year, feature/roadmap delivery had gone from first place to last, which we think is appropriate.
Also, we were very pleased that retention/churn placed near the top of the list. We’ve said it before, and we’ll say it again: PMs (not just sales and CS) need to be concerned about retention.
Roadmap/feature prioritization
Where do the best ideas for feature come from, and which sources should be given the most weight when planning your roadmap? These are key questions for every product team, so Pendo asked about them in each SOPL survey.
In 2017, the results of the SOPL survey showed a decided lack of balance:
In spite of many product teams not wanting to be competitor-focused or reactive, the reality was that they were. Much more weight was placed on feature ideas inspired by what competitors were doing than on requests from customers and/or users.
In 2018, this balance began to shift.

This time, nearly equal weight was given to customer requests and competitor-inspired features. In fact, survey respondents shared that the source of their best feature ideas was their customers.
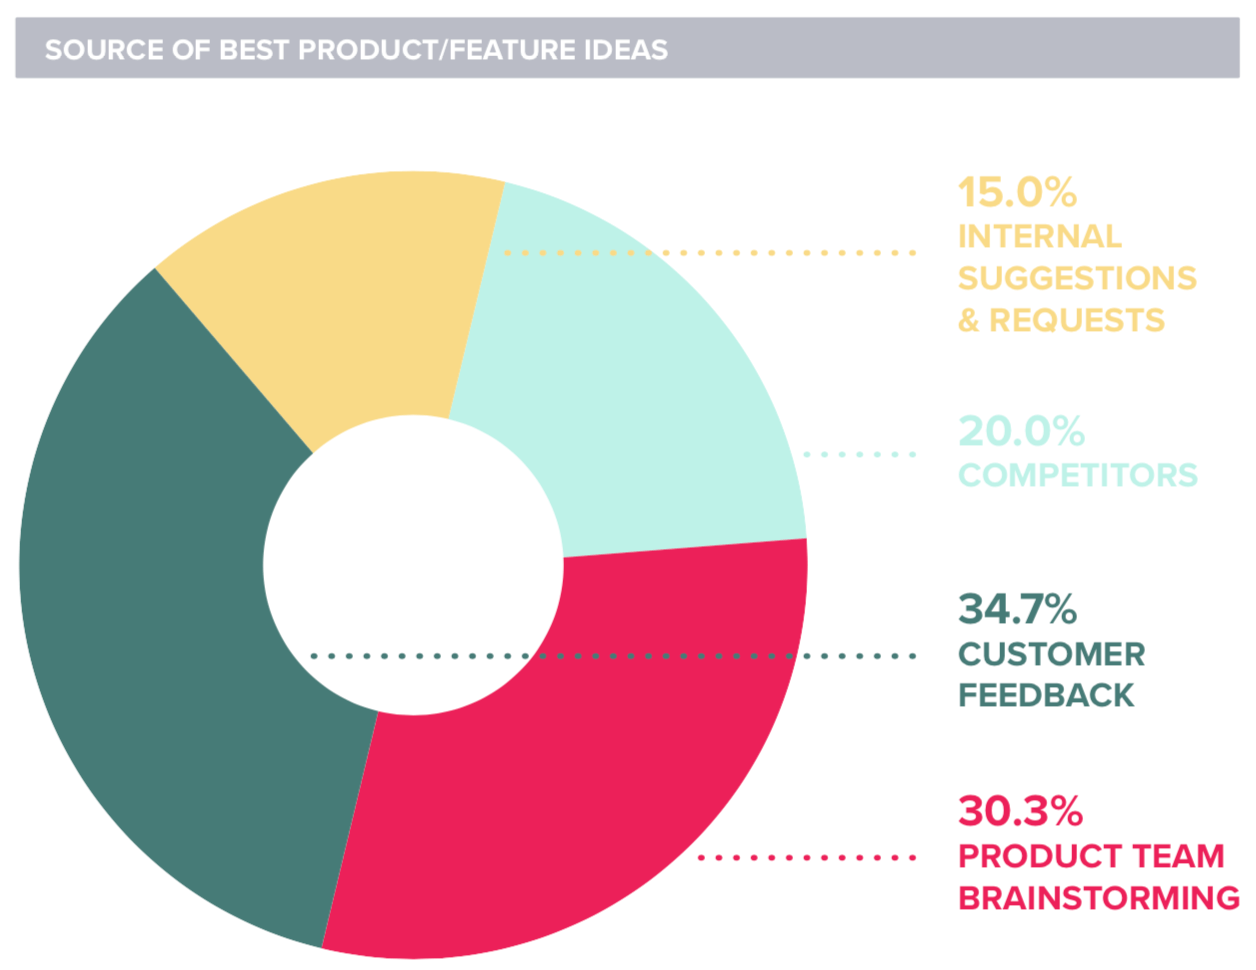
In the latest edition of The State of Product Leadership report, customer feedback remained in the top spot as a source of feature ideas:
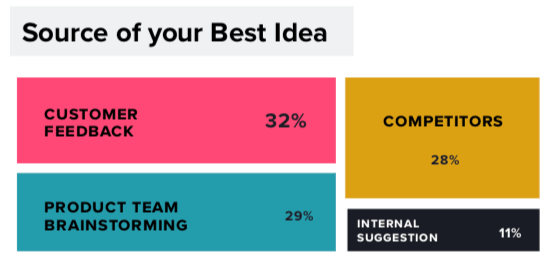
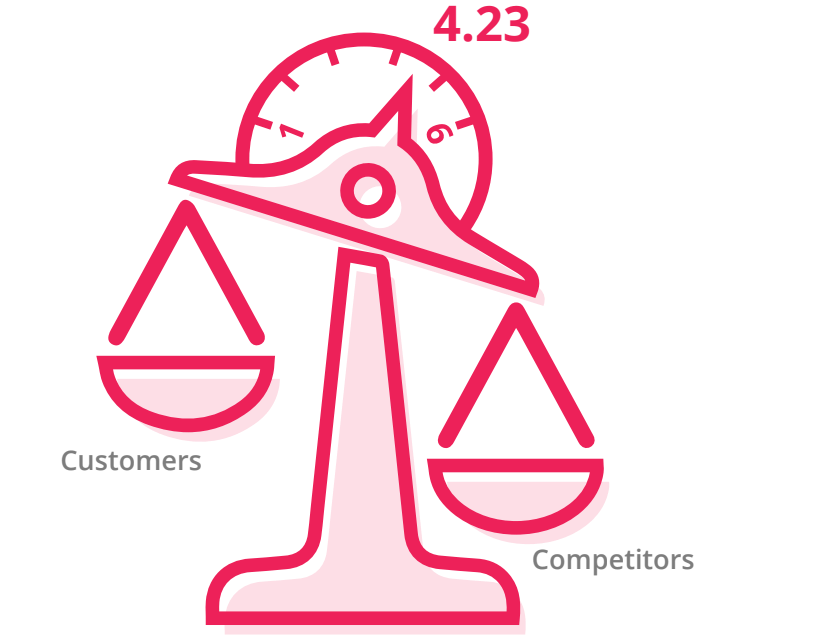
However, competitors gained quite a bit of ground from 2018 to 2019, growing from 20% to 28% of the vote for “source of your best idea.” And in terms of weight, competitors started to get more:
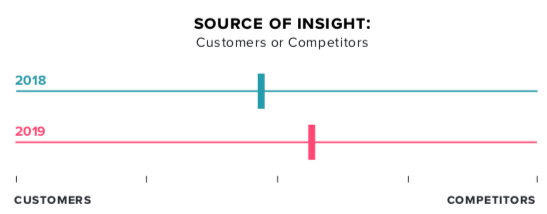
This is an interesting development, and one we hope will be examined in next year’s SOPL report as well. Is the pendulum swinging back in favor of competitors? Are product teams becoming more reactive to the pressures of intense competition?
Want to read all three SOPL reports for yourself and learn more about the evolution of the PM role? Check out the 2020, 2019, and 2018 editions.
![[object Object]](https://cdn.builder.io/api/v1/image/assets%2F6a96e08774184353b3aa88032e406411%2F16f37ced85d74e44a13b1a8661791801?format=webp)
![[object Object]](https://cdn.builder.io/api/v1/image/assets%2F6a96e08774184353b3aa88032e406411%2F4a130d48354c433ebeae2ce417be0c1d?format=webp)
![[object Object]](https://cdn.builder.io/api/v1/image/assets%2F6a96e08774184353b3aa88032e406411%2F74966106286547e1937f3ff9fb35f2ac?format=webp)
