Introducing retention analytics from Pendo
In the SaaS industry and frankly for any digital product, retention is one of the most important measurements for product and growth teams. It’s a great proxy for customer value. If users keep using a product, they must be getting some value from it. Pendo’s new Retention Analytics feature makes it easy to see whether users return to a product and engage with it after their first use.
What is Retention Analytics?
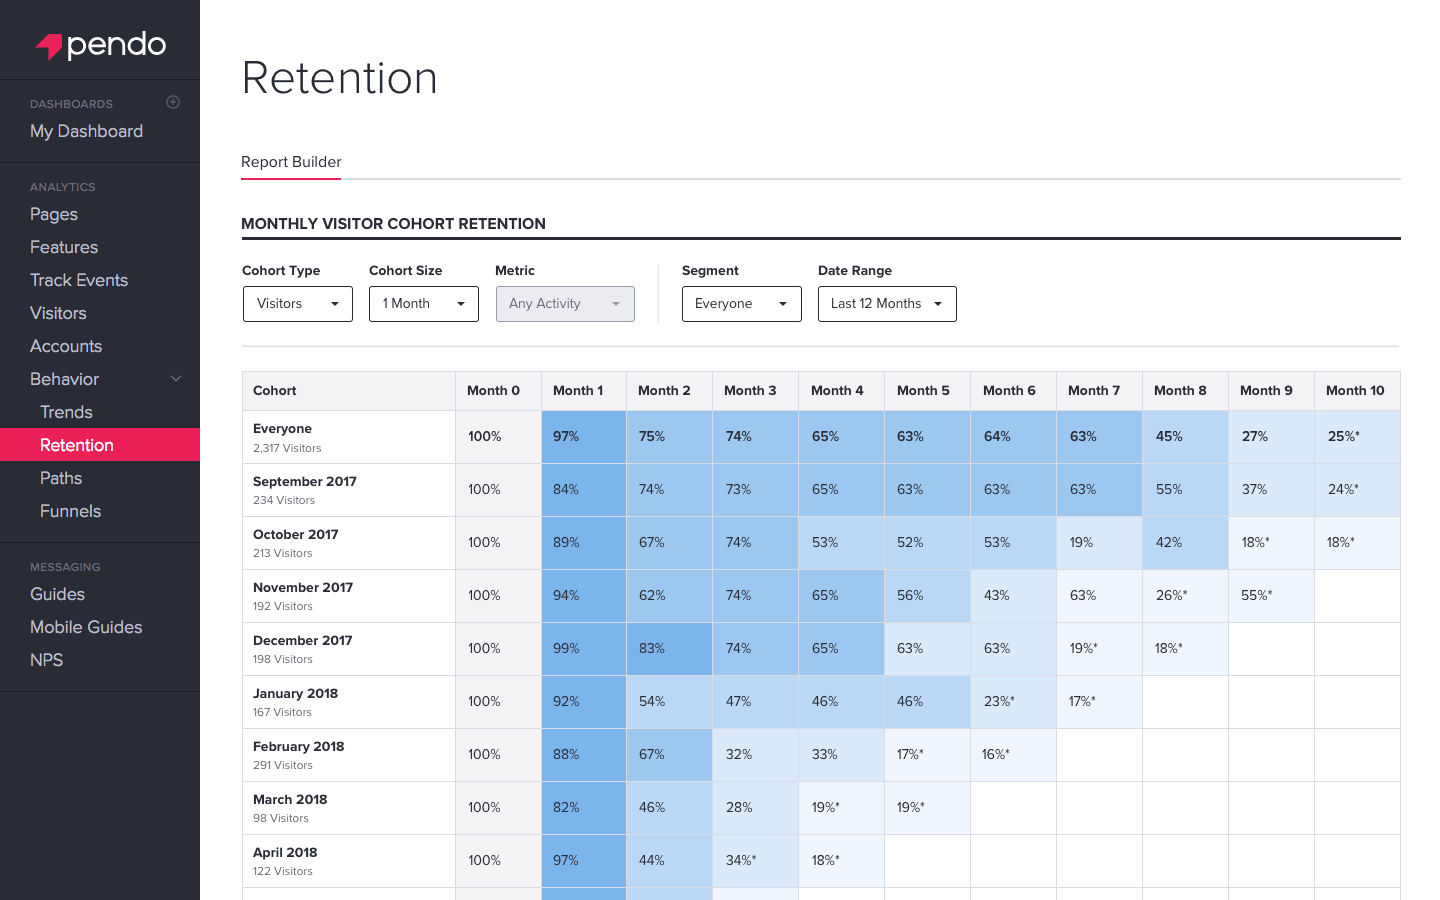
The retention visualization in Pendo is a fairly common way to look at how users re-engage with a product. It breaks up new users into time-based cohorts based on the particular week or month when they first visit your product (this is why the visualization is sometimes referred to as a “cohort report”). Then each subsequent cell in the chart shows the percentage of that particular cohort who re-engaged with the product. The cumulative visualization provides an easily consumable view of how well your product is retaining users.
In Pendo, “Retention” is a new menu item under the “Behavior” tab. Launching the feature brings up a default monthly retention report for the past six months. You can then customize the cohort type, size, user segment, and date range for the report.
Why is Retention Analytics valuable?
SaaS/digital products are never static. You’re constantly making changes, adding features, and if you use Pendo, using in-app guides – all geared towards improving the product experience for your users. The time-based view of the retention chart allows you to look at time periods when significant product changes happened, and track the effects of those changes on subsequent cohorts of users.
Exploring retention across different segments can help you identify specific user attributes, or product features that are correlated with higher rates of retention. Pendo helps you answer questions like:
- Do large or small accounts have higher retention rates?
- What features are used most heavily by users who return regularly?
- How many iOS, Android, or Web users come back within a specific time frame?
Higher retention = greater lifetime value
For any company that depends on recurring revenue, improving retention rates can have a dramatic impact on customer LTV, and ultimately product revenue. Pendo’s new Retention Analytics helps companies identify what keeps users around, and understand how to create a more “sticky” product experience.