Editor’s note: This article originally appeared on the Pendo blog, and in January 2022 Pendo updated the calculations for two of the Product Engagement Score (PES) components. Learn more about the changes to PES here.
As humans, we naturally crave simple, aggregated numbers. As product people, we need our numbers to be easy to calculate, yet powerful in informing decisions, strategies, and roadmaps.
But, when it comes to measuring product engagement, there are a lot of different metrics to consider, not to mention different ways to define and calculate them. Historically, there hasn’t been a single, standardized way to assess how users are engaging with your product — until now.
The product engagement score (PES) was born out of the idea to finally have a singular view of product engagement, and be able to quickly diagnose how a product is performing. It’s something I (and many others at Pendo) have been developing for several years. Yes, it took years, and plenty of iterations before getting to where it is today. Here’s a look into how PES came about, and why I believe it’s such a valuable metric for product teams.
The journey to PES
PES’s origin is closely tied to another popular product metric: Net Promoter Score (NPS). The premise of NPS was to create a simple (i.e. one question) survey that’s easy for users to fill out, and equally easy for companies to understand how those users feel about their product. Fast forward a couple decades later, and NPS has become the product metric that executives, investors, and venture capitalists ask for. This bothered me, not because I don’t think NPS is valuable — it is and we measure it — it just doesn’t tell the whole story.
I started thinking about why people gravitate to NPS. Yes, it’s important to measure sentiment. And yes, the question of “how likely are you to recommend this product?” is powerful, since word of mouth is a big growth engine for technology companies. But I really believe the reason NPS is so attractive is because it simplifies measurement down to one number. And if NPS is all about how users feel, I wanted to come up with an aggregated score that reflects how users engage.
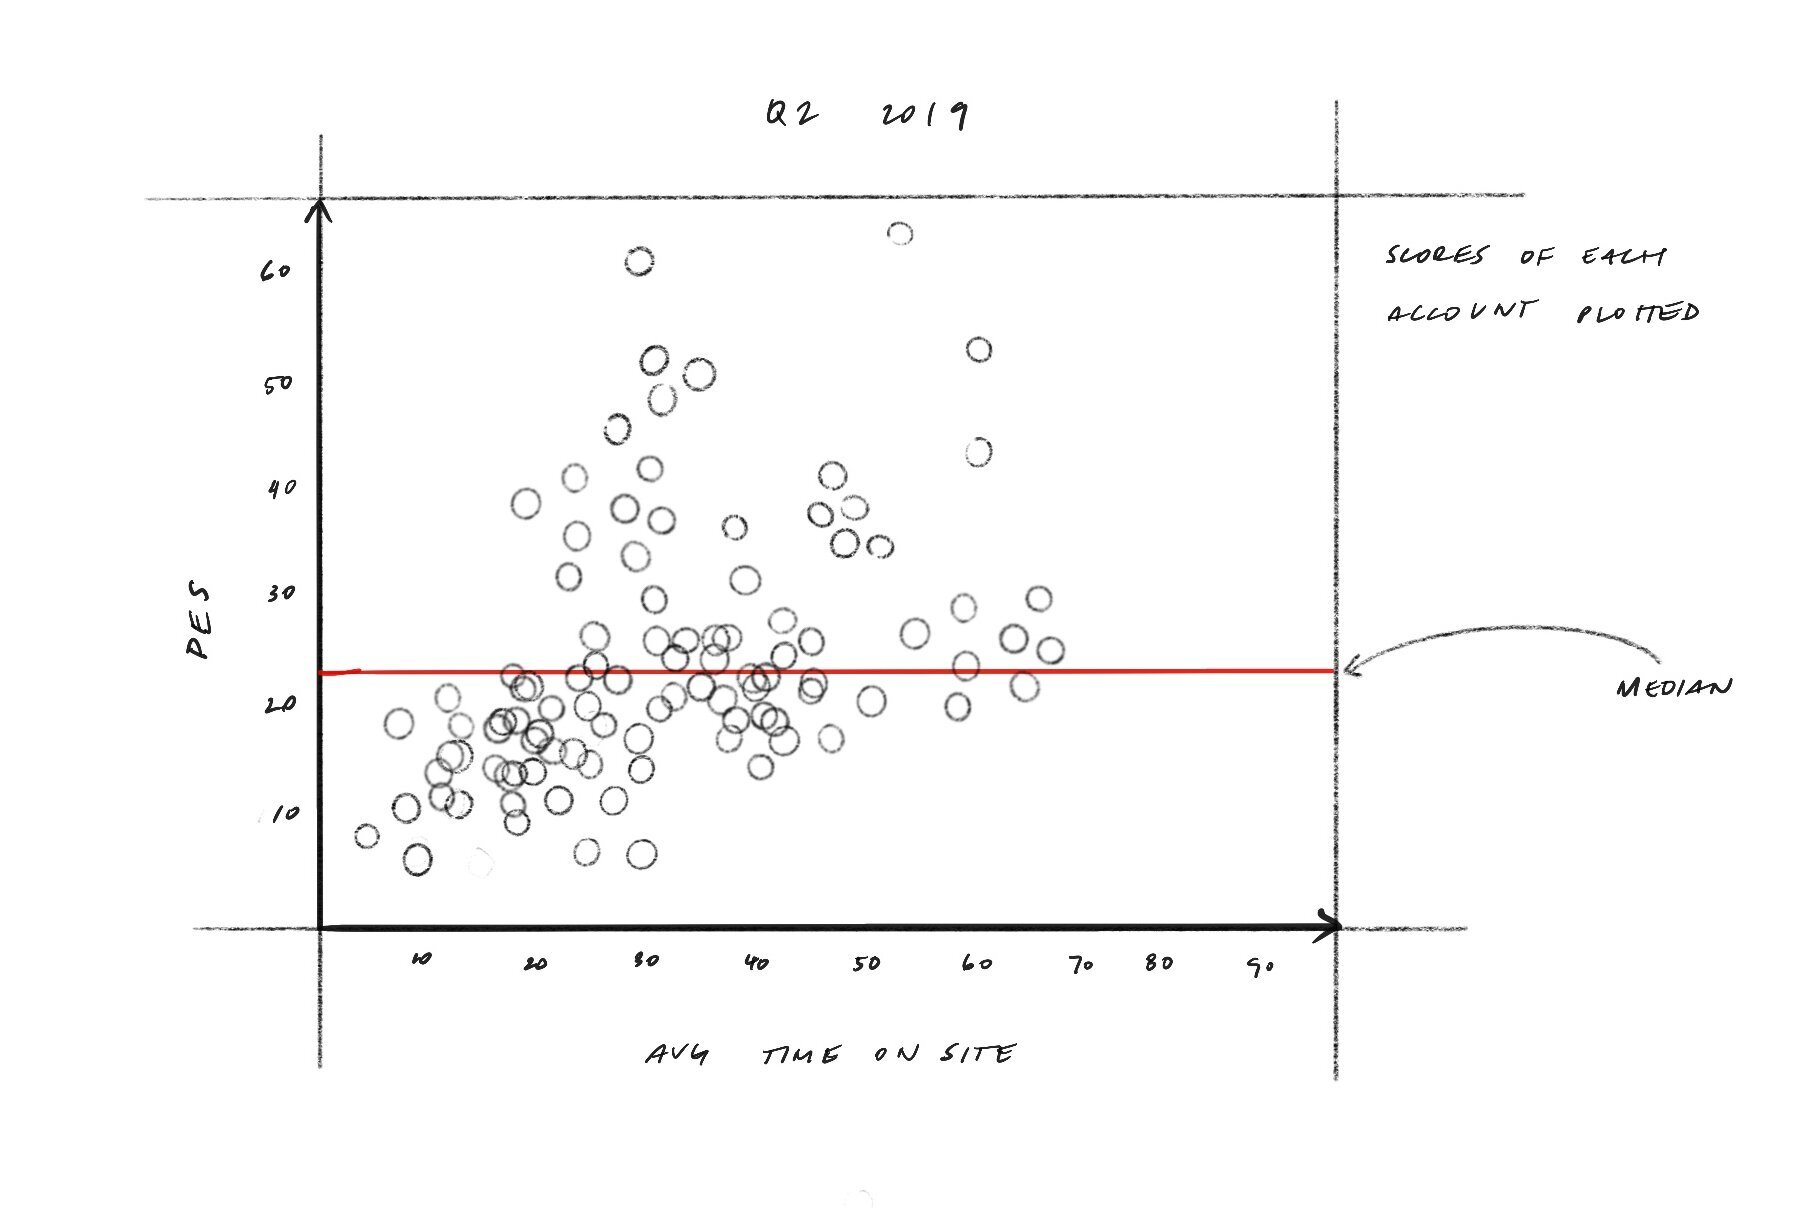
Here’s a sketch from our early work with PES – taking a look at the correlation between PES and average time on site.
The early challenge was determining what information would feed into this single number. I worked with Pendo’s data science team, and we decided to utilize a common framework for measuring product engagement — breadth, depth, and frequency — and take the average of those three numbers.
Since there are so many different ways to measure each metric, we had to think carefully about which measurements for breadth, depth, and frequency to use. As we worked through different iterations, we quickly realized that there needed to be a balance between the complexity of the calculations and the ease of comprehension.
If the metrics were difficult to calculate and difficult to explain, no one would use PES. If the metrics were easier to understand but still difficult to calculate, the chances of it catching on were slim. But if the calculations were too simple, we ran the risk of offering up a number with little inherent value. We also wanted to ensure each metric was easily accessible in Pendo for our customers.
This is what we landed on:
- Breadth = feature adoption (the percentage of features that generate eighty percent of click volume)
- Depth = app retention (the percentage of users retained in the first three months of usage)
- Frequency = stickiness (the percentage of users who return daily: DAU/MAU)
How to calculate your PES
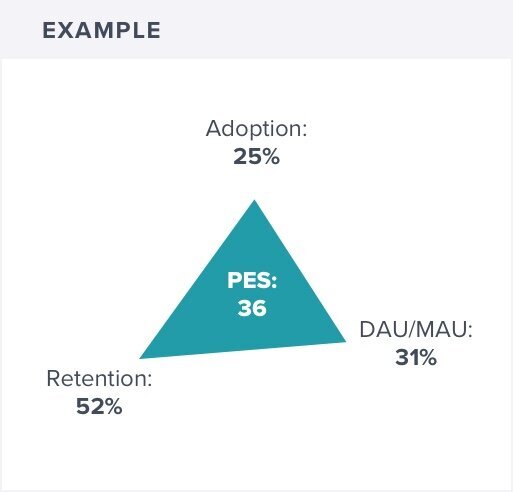
Since PES is the average of feature adoption, app retention, and stickiness, the calculation is simple once you know those three numbers. PES can be expressed mathematically as:
[(Feature Adoption + App Retention + Stickiness) / 3] * 100
One number, actionable takeaways
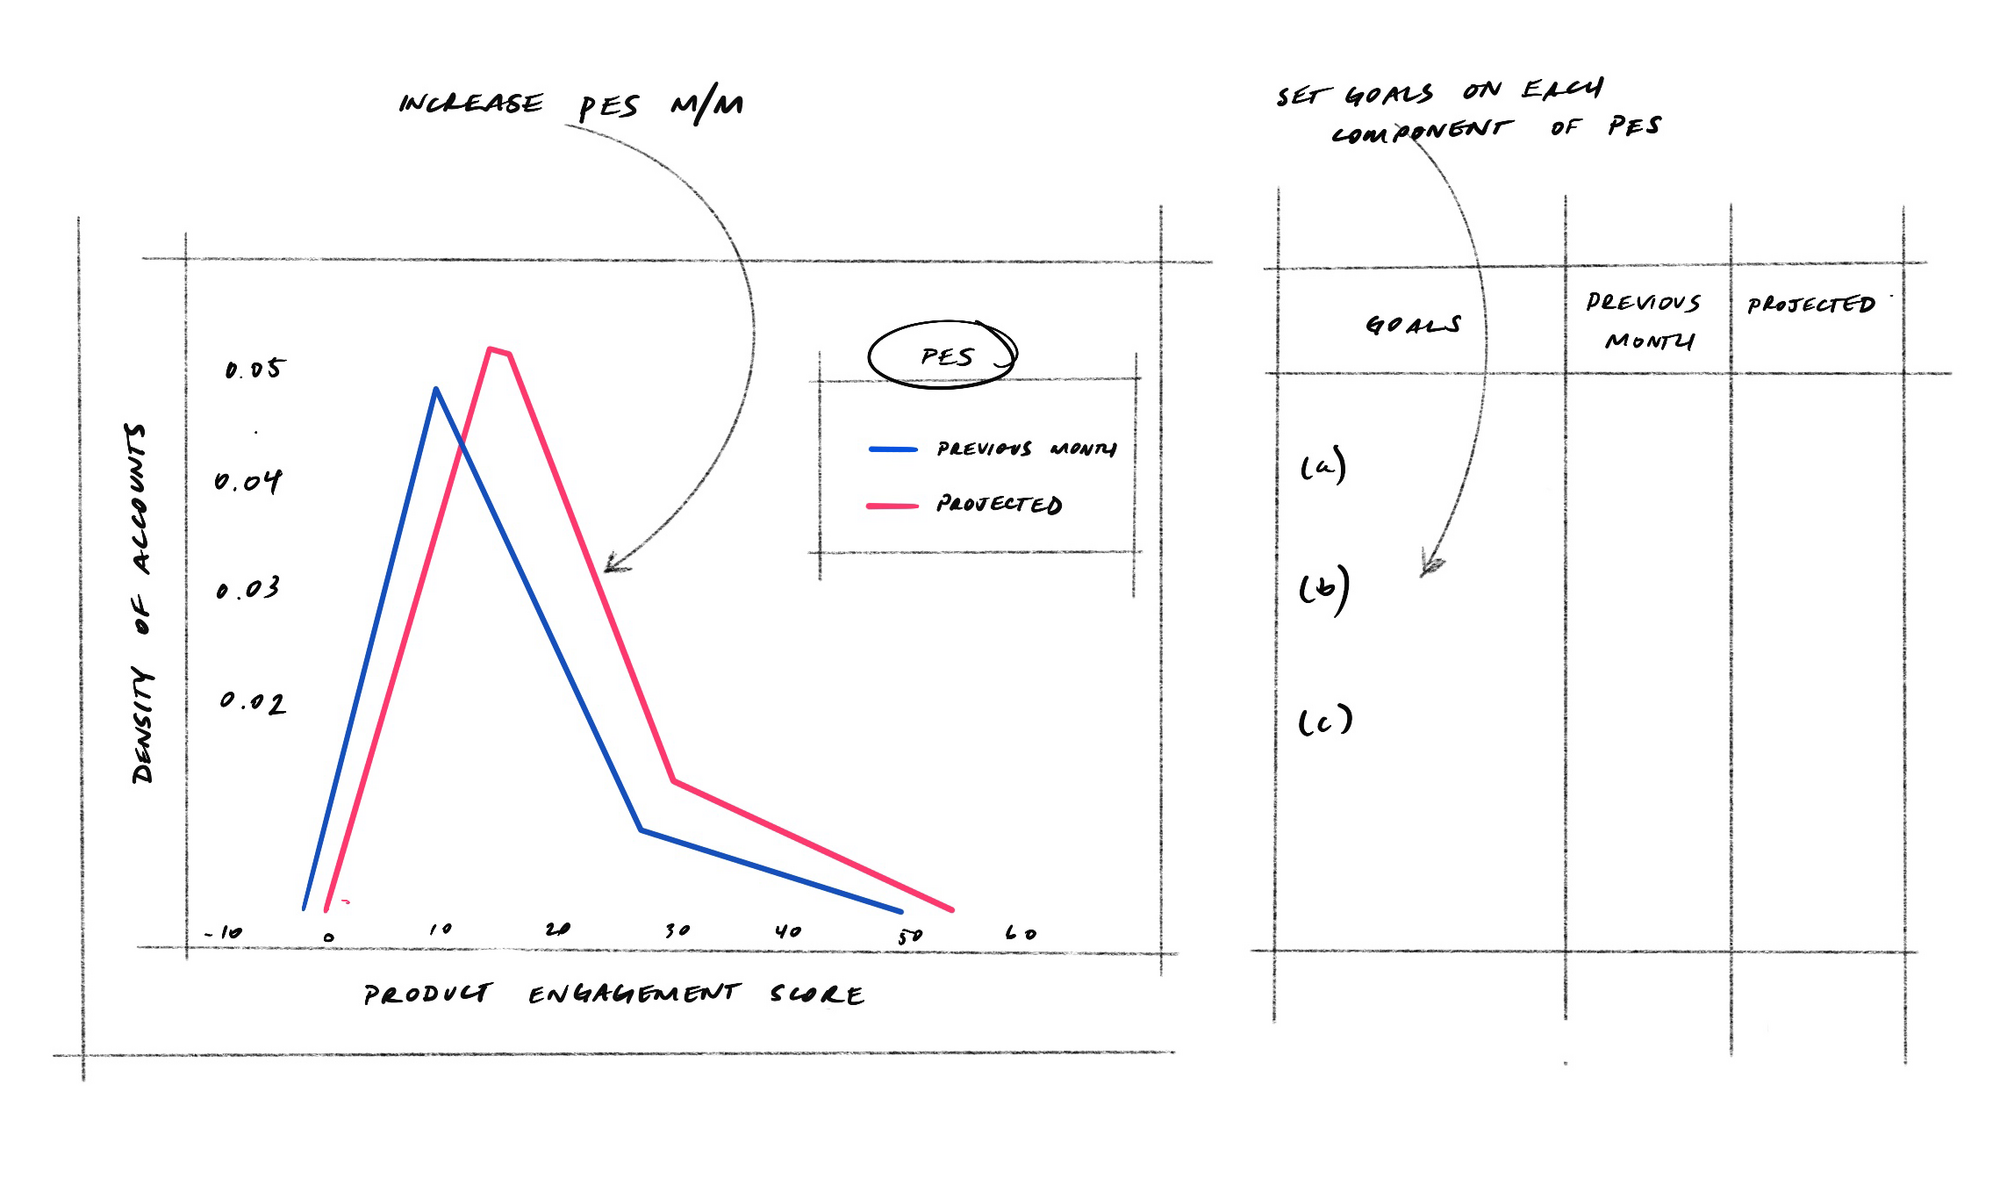
In addition to offering a simple way to measure product engagement, what I love about PES is that it allows you to dig into the why, and helps you narrow in on what needs improving. For example, if I see a low PES, I can look at the three individual metrics and identify which one or two may be bringing down the average.
Looking ahead
Like any form of measurement, PES comes with its nuances and challenges. For starters, one’s PES likely won’t fluctuate as much as NPS does, since it largely depends on the volume of product usage. It’s still valuable to measure PES monthly, but I think it especially aligns well with things like quarterly board meetings and retrospectives.
More importantly, this is only the beginning for PES. I see it as a launching point for shifting how companies think about product measurement — a push towards something beyond the NPS-dominated landscape. If I’m a VC, I can ask a company for its NPS and its PES, and get a very clear understanding of the product’s value.
Do you know how your PES stacks up? Check out the product benchmarks to learn your product’s relative performance for PES and four other key KPIs.
![[object Object]](https://cdn.builder.io/api/v1/image/assets%2F6a96e08774184353b3aa88032e406411%2F846715ac5c26410bbb6ffd8f6caa4e70?format=webp)
![[object Object]](https://cdn.builder.io/api/v1/image/assets%2F6a96e08774184353b3aa88032e406411%2Fa62864d2453e4b12aee3eca57c793788?format=webp)
![[object Object]](https://cdn.builder.io/api/v1/image/assets%2F6a96e08774184353b3aa88032e406411%2Fd770afd0ea5f4436a208166ea13b742d?format=webp)
