
Table of Contents
In a rush? Download the PDF for later
Download the e-BookIn today’s business press, we hear a lot about the rise of the digital workplace, particularly since the pandemic. What’s often implied but not always explicitly stated is that the digital workplace has become synonymous with the workplace itself. This has huge implications, not only for how employees collaborate and execute on work, but also for how company leaders think about workplace tech in the context of their greater strategic and business goals. It’s no surprise that 74% of IT heads say the CIO role was elevated due to the pandemic.
It’s more important than ever for companies to invest in digital transformation and bring together IT and business operation objectives. According to a recent McKinsey survey, 73% of top performing companies now say that their CIOs and senior IT leaders are heavily involved in shaping company strategy. With that shaping and planning comes the need to measure and build accountability around shared KPIs. But which are the most important ones for an optimized digital workplace?
Right now, many companies are working to strengthen the digital workplace in three key ways: with initiatives to increase productivity, improve experiences, and optimize software—both the third party internal-facing apps you buy and the homegrown ones you build.
The problem? Too many companies are executing on these initiatives in silos. This is unfortunate, because a mature, effective digital workplace sits at the intersection of these three pillars. But how should teams best measure progress within and across these core areas? And how does improvement in each of these areas make for an improved digital workplace? Here are ten KPIs every business technology and operations team should track for the digital workplace, plus tips for taking action on the data to optimize IT initiatives and improve the employee experience.

KPIs to measure and increase productivity
1. Workflow productivity
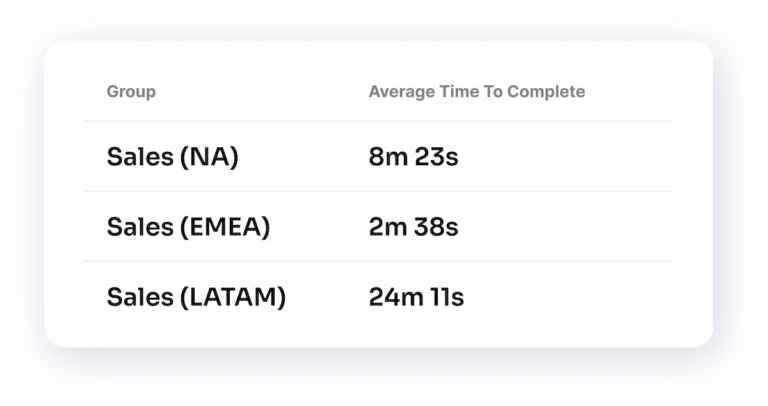
In order to boost productivity, organizations have to decide how best to measure it and arrive at a baseline off of which to set future goals. Workflow productivity is the amount of time it takes for employees to complete business-critical workflows. What constitutes a business-critical workflow varies by context—it can be either a one-time or infrequent workflow (e.g. security trainings, performance reviews) or a recurring workflow (e.g. processing loan applications). The operations team’s focus should generally be on improving the latter because of their frequency and impact on things like revenue attainment and customer satisfaction. What’s more, the average time to complete a workflow is not only a measure of productivity, but a baseline of the effectiveness of that process as designed. Is a process slowing down your users? Is it adversely impacting the customer experience because it directly slows the speed of service delivery? These are the types of questions you may encounter when investigating workflow productivity.
How to take action on workflow productivity
- Once you have a workflow productivity baseline, leverage analytics from a digital adoption solution to see the flow of work across apps and across time. It may be that for certain workflows, employees are taking longer to finish because they’re getting stuck at a given point or encountering friction in some way that could be solved with better support. If there’s a particular form field that employees are confused about, for example, consider deploying an in-app notification to give them context and guidance on what the field is for and how to complete it in the desired way.
2. Process adoption
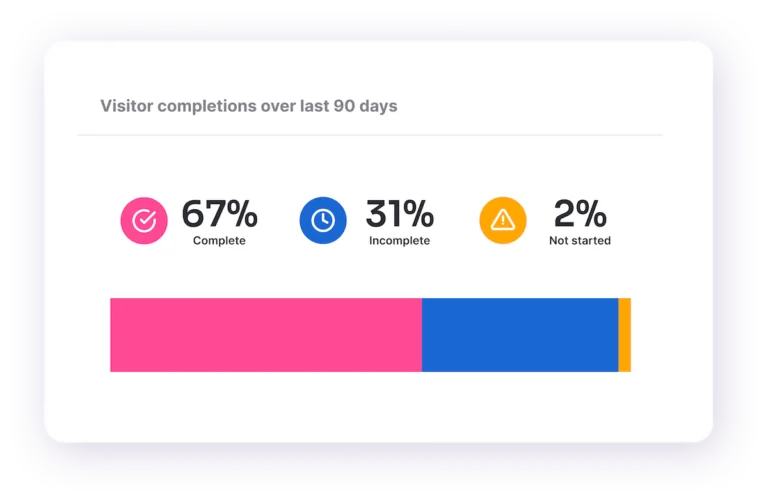
Process adoption is an activation metric that measures how many users are completing business-critical workflows. Most key work happens not just within a single application, but across multiple apps, so it’s important for operations teams to get a sense of how teams move through various platforms to get work done—and whether users are completing processes in the intended ways to ensure compliance. Risk management, operations, or other teams focused on business process effectiveness can use the powerful analytics from a digital adoption solution to see the flow of work across applications and identify if employees are actually completing workflows. Depending on whether the intended workflow is recurring or non-recurring, how teams consider and interpret adoption rates will vary.
How to take action on process adoption data
- For workflows with low or slow process adoption: When you notice employees aren’t completing key workflows or are struggling to do so, you should first focus on learning as much as you can about these users via analytics. What patterns are you seeing? Do these employees share common behaviors or metadata (e.g. is it their first time undertaking a process, or do they work out of the same office or share the same position)? Is there a specific point within the workflow where users are dropping off or encountering friction? Having these insights can help teams optimize processes and provide the right guidance and support to employees within and across apps so they can complete workflows in the desired ways.
- For workflows with high and fast process adoption: If employees are completing workflows and processes quickly—and in the intended ways—the most important thing operations teams can do is leave them alone. These are superusers, and you can use them as an example to help everyone else achieve the same outcomes. Harness analytics to better understand what sets these users apart, and let those insights inform process tweaks and in-app support related to common workflows. What’s more, leaving these users alone allows ops teams to better scale their work, removing unnecessary tasks and maintenance from their plate.
How process adoption leads to better business outcomes
A leading home improvement retail business wanted to help its employees drive more revenue in its B2B wing, selling supplies to independent workers and contractors. To further this goal, the company launched a lead generation process within its homegrown customer relationship management (CRM) software that helped employees find professionals with upcoming jobs and projects. It launched a trial in which it used Pendo In-app Guides to drive adoption of this lead generation process at 100 stores. The company found that stores using in-app guides had adoption rates 2.5x higher than those that only used traditional means of driving awareness (e.g. email). It also found that the test group of stores increased monthly revenue by an average of $1.5 million more than the control group.
3. Application adoption
Application adoption is a metric that measures how many users are engaging with a specific application or tool. It’s often reported over time by the number of monthly active users (MAU), weekly active users (WAU), or daily active users (DAU). By understanding the level and quality of engagement with a given app, business technology teams can discern whether the business is generating a good return on investment (ROI) for it.
Businesses often only begin tracking and addressing application adoption once a digital transformation is well underway, but this is a mistake. According to McKinsey findings, the most successful CEOs “are as passionate about adoption as they are about strategy. They invest time up front in making sure that the people actually using the solutions…have a clear voice in the development process.”
It’s important to note that the goal of the application should inform the desired adoption rate: Does it serve a business-critical purpose? Is it something employees can opt into? Or does it only require seasonal engagement—for example, updating your HR info at a certain point in the year?
How to take action on application adoption data
- If you notice low adoption of a digital tool or app, you can leverage the analytics of a digital adoption solution in a similar way to that of process adoption. Is there a specific subset of users struggling to use the app, or is low adoption organization-wide? Are employees even aware that they’re supposed to be using the app? Also consider the context: Is the app used for an infrequent, non-recurring task or process? If so, low adoption may not necessarily be a problem. Depending on the answers to these questions, you can take steps to increase adoption via in-app alerts and guidance or solicit feedback to get a better understanding of how best to support employees with the app.
4. Support deflection
Reducing the amount of time spent manually providing support to employees is always an important goal. The most forward-thinking teams are leveraging digital adoption solutions to provide always-on automated support and guidance to help get their teams unstuck, and up and running faster. Teams can measure support deflection by taking a baseline measurement of the amount of ticket requests it gets related to given apps, tools, or processes, and then comparing that number to the amount it gets after a given period of time following the deployment of in-app support resources. These solutions can take the form of an application help center or resource hub, which houses support and guidance around various processes and functionality. Support can also come in the form of training deployed within the app itself to individuals or teams around a given task.
How to take action on support deflection data
- If you notice a low level of support deflection, take a step back and reassess the in-app interventions you’ve made. Does the resource center contain support that’s relevant to the individuals or teams requesting support? Could a given in-app training or guide be made clearer? Is support targeted to the right users? Is too much support on offer, with employees tuning it out because they can’t find what they need?
What successful support deflection looks like in practice
- When a top financial services enterprise wanted to lower the amount of support requests it was receiving from employees, it turned to Pendo on over 40 internal-facing applications to drive real results. Rather than wait passively for queries to come in, this company got ahead of things by leveraging the Pendo Resource Center to create sources of truth within apps around key processes, workflows, and best practices. It also utilized in-app guides to deflect “walk me through a process” and “educate me about X” type requests. The result was a staggering 60% decrease in support request volume, coupled with a 14x increase in Resource Center views. This led to greater productivity among branch employees, who were able to quickly self-serve and get back to customer interactions instead of waiting on the home office support center.
KPIs to measure and improve employee experiences
5. Employee satisfaction
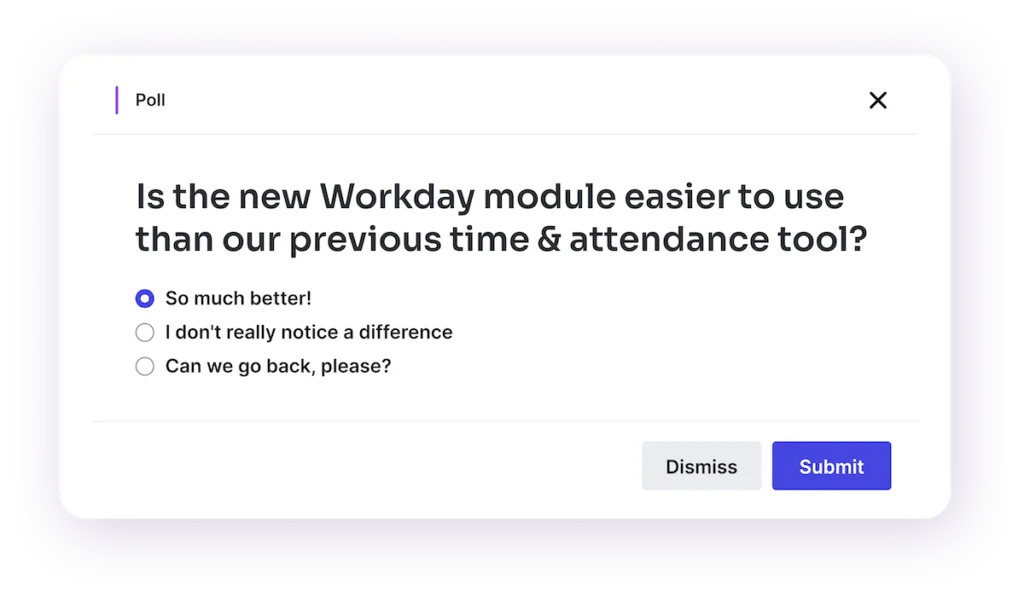
At the company and department level, a lot of work goes into understanding the overall employee experience. In order to improve it, teams need to baseline and measure employee satisfaction. Although the precise means by which they do so varies by organization, employee satisfaction is generally taken as holistic, digital-workplace level (or tech-stack level) feedback to assess what people experience and feel about workplace technology and ways of getting work done. Sometimes this comes in the form of an annual employee survey, which gives IT teams insights into the state of employee morale. As the workplace has become increasingly more digital, an employee’s experience with software more and more determines their experience in the workplace as a whole, so it’s important for IT to regularly evaluate this kind of feedback.
How to take action on employee satisfaction
- Give team members the means to explain their survey responses and satisfaction level. Often, that comes in the form of text boxes in which they can elaborate on or provide commentary about why they feel a given way. It may be that dissatisfaction centers on a specific app or workflow (more on that below). Or it may be that teams feel a lack of general support around technology, or are having difficulty getting the answers they need. Whatever the issue may be, IT teams should identify the specific causes of general dissatisfaction in order to remedy the situation.
6. Segmented application Net Promoter Score (NPS)
Net Promoter Score (NPS) is one of the most common means that businesses use to gauge customer satisfaction and loyalty. It comes in the form of a one-question survey that asks, “How likely is it that you’d recommend this brand to a friend or colleague?” Customers answer the survey on a scale of 0-10. Scores of 9 or 10 are considered “Promoters,” 7 or 8 as “Passives,” and 0 through 6 as “Detractors.” Companies then subtract the percentage of Detractors from the percentage of Promoters to produce their Net Promoter Score.
Application Net Promoter Score works the same way as NPS, but it is delivered to employees for a workplace app or software (“How likely is it that you would recommend this product or application to a friend or colleague?”). With segmented NPS, business systems teams consider the frequency with which individuals or teams use an application when evaluating their scores. For NPS scores pertaining to a Customer Relationship Management (CRM) tool, for example, sales teams who use the app with the most regularity and frequency would have their scores scrutinized most closely or weighted more heavily.
How to take action on segmented application NPS data
- Examine NPS scores by frequency segmentation. For example, if you’re trying to drive up adoption, you may want to look at infrequent users’ scores to better understand what might be holding them back from greater engagement. High-frequency users’ scores can be examined to best understand the impact the tool in question has on productivity and general morale. If scores are especially low, follow up with high-frequency users to better understand what’s driving their low rates of satisfaction. Is the tool not well-suited to the purpose for which teams are supposed to be using it? Is there confusion around the use of the tool or a feature within in a given workflow or process? Knowing the answers to these and other questions can help IT teams plan interventions designed to raise scores over time.
Should I segment all my metrics?
When it comes to application NPS, segmentation is a must-have to glean real value from the metric. After all, the employees using an app most frequently and in role-critical ways will have a greater breadth and depth in the feedback they provide. But employing segmentation can also make other metrics more meaningful depending on the context. When it comes to application or feature adoption, for example, segmenting by role or team can also be useful. Consider a feature added to a sales CRM app that’s targeted to enterprise teams in particular. In that case, it makes sense to segment adoption by market (weighing enterprise team member adoption heavier) in assessing the health of adoption rates.

7. Employee feedback
Businesses collect employee feedback in many forms, for many elements of the digital workplace. Companies can track everything from top feature and enhancement requests, to business process improvement recommendations, to crowd-sourced best practices for a given app or workflow.
No matter what kind of “voice of the employee” program a company has in place, the level of proactive employee engagement with these programs is a good indicator of how invested they are in improving the employee experience. And business technology teams can learn a lot from that information. What features of the digital workplace do employees care about the most? Which apps and workflows have the greatest impact on their experience, either positively or negatively? The contextual insights you get from tracking feedback helps teams answer these and other similarly important questions.
How to take action on employee feedback
- Knowing which feedback channels and which products or workflows they relate to get the most proactive engagement helps IT or operations teams inform decisions about what to prioritize in their roadmap. If they see an unusually high level of engagement in feedback around improving a particular business process, for example, it indicates that the process owner should probably focus on optimizing that process ASAP.
KPIs for optimizing software tools
8. Return on investment (ROI)
IT should always measure the success of an application or digital project by the value it provides to the business. In turn, those funding IT should understand that value and determine an appropriate return on investment based on it. For any piece of software to generate a good return on investment (ROI), it should make or save an organization more money than the spend they put into it or otherwise mitigate risk in some meaningful way. There are a number of factors you can measure that contribute to a standard measure of ROI across SaaS tools.
One critical component of determining the ROI of software is time to value, or the amount of time from when an employee starts using an app to when the business begins deriving value from it. Another is license utilization rate, or the percentage of licenses a company has purchased for a given piece of software that is actually being utilized. A third is risk mitigation, or how well an app eliminates or reduces various risks (around security or compliance, for example) in a significant way.
How to take action on ROI data
- For users experiencing slower time to value, consider whether they are getting the right onboarding and support experiences. How have you developed your onboarding strategy for users, and can you accelerate their onboarding trajectory? Is change being introduced at a pace that is causing fatigue or confusion? Is training being done in person, with how-to information and tips difficult to access after the session is done? Or is it being deployed within the app when teams need it most, and always accessible thereafter in the resource center?
- For software with low license utilization rates, use analytics to gauge which users are not using the software and see what patterns emerge. Do they share a department or position? Is the company already paying for software that can serve the same purpose? Depending on the answers to these questions, IT might be able to reduce the number of licenses it’s paying for, freeing up budget and boosting the ROI on that software in the process.
9. Total cost of ownership (TCO)
Every piece of software comes with costs, but it can be challenging for IT teams and business leaders to discern precisely what those costs are and what they amount to because so many of them are indirect in nature. Total cost of ownership (TCO) is a metric that takes into account the entirety of costs, both direct and indirect, around a given piece of software. That means license costs, support costs, engineering and onboarding costs, maintenance costs—everything necessary for deploying the software, keeping it up and running, and prioritizing the right updates and fixes for employees. Once teams establish TCO baselines around software, they can identify opportunities for improvement.
How to take action on total cost of ownership
- For software with a high total cost of ownership, IT teams can break the costs down to see what specifically is driving spend on the app, and then take steps to lower it. It may be that a given app has a low license renewal cost but high costs around maintaining and upgrading it (some apps even require extra tools to be properly updated, for example). Knowing which element is driving up costs helps IT teams form the right strategy to lower them.
How a leading commercial real estate firm lowered the TCO of a key workplace app
JLL, one of the oldest, largest, and most storied commercial real estate firms in the world, is pushing innovation in property technology forward via its JLL Technologies arm. One key JLLT app is Blackbird, a geospatial visualization platform built to showcase market knowledge to clients—and do so in a visually compelling way that leaves them wowed. The JLLT team wanted to ensure brokers were both aware of and able to gain value from new product features without placing too heavy a burden on engineering. It turned to Pendo’s In-app Guides to support and familiarize users with new features—and immediately began seeing a reduction in task time. What used to take an engineer three days as a manual build could now be handled by a product manager in an hour, dramatically lowering the resources required to maintain the app.
10. Portfolio sprawl
Perhaps no problem has plagued IT departments more since the pandemic than SaaS sprawl—the proliferation of apps (and the costs associated with them) in companies’ internal app suites. It’s imperative for companies to have the right-sized digital portfolio for their needs, and measuring portfolio sprawl helps IT teams gauge how far off they are from where they need to be. They may choose to measure sprawl several ways—in terms of the number of internal-facing apps overall or the number of apps per user, for example.
How to take action on portfolio sprawl
- After taking an accurate and comprehensive inventory of what’s in their portfolio, IT teams and business systems leaders can move toward adjusting their portfolio size to fit their needs. One way to do so is by leveraging digital adoption solution analytics to examine the usage of each app and decide whether it merits more investment, can be held as-is, or should be retired. Many companies, for example, unnecessarily pay for duplicative apps—apps that serve the same purpose or provide equivalent functionality as others already in the portfolio—when they could (and should) actually retire them.
A mature digital workplace means better business outcomes
Measuring the KPIs shared in this guide helps IT and operations teams design a digital workplace with intention and improve what’s on offer. When a company moves from a makeshift and chaotic digital workplace to building one composed of workflows, apps, processes, and elements that work in concert with one another, employees and the business as a whole benefit greatly. Gone are the days of having to perpetually triage one element or another just to keep things moving.
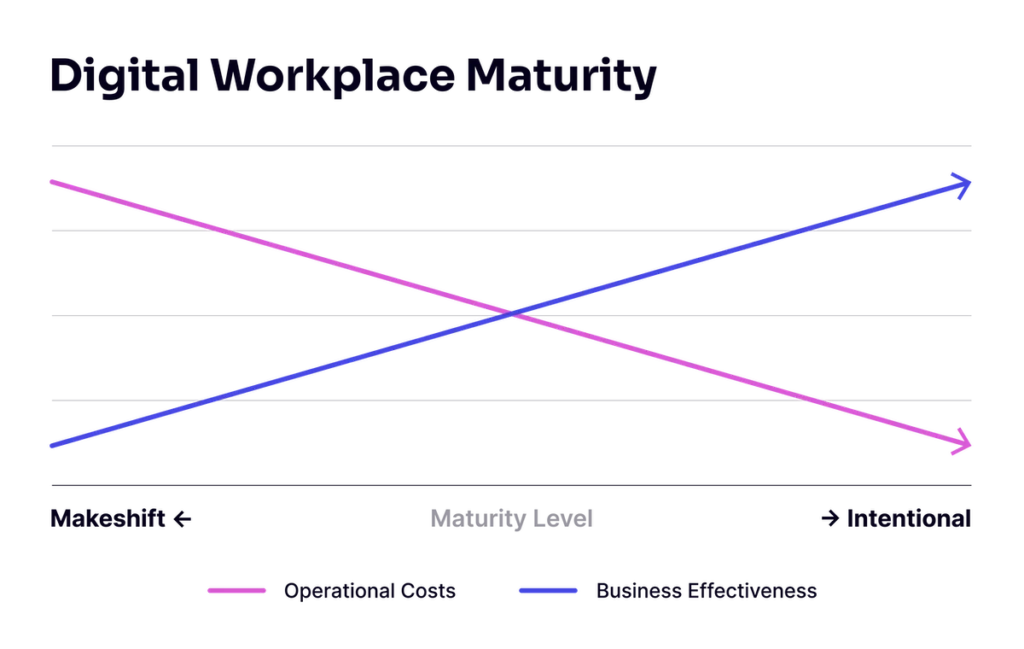
When you have a mature digital workplace, operational costs go down, business effectiveness goes up, and you’ll gleanbetter outcomes for company and employee alike. And there’s no time like the present to start improving things. Are you ready to build a digital workplace that works for you?
