There’s a lot that goes into managing a business’ software portfolio, but in this blog post we’re going to focus on one of the most foundational components: determining which internal tools employees are using, and how.
One of the best ways to increase business efficiency is to make sure the money you spend on digital workplace technology—the software your employees use to execute on goals every day—aligns with the value you’re getting from it.
So how do you know if you’re spending too much—or in some cases, too little—on internal-facing software? How can you make the best possible decisions about technology and have the clearest understanding of the value it adds to the business?
It all starts with understanding how employees use digital tools. And product analytics data can help you answer the above questions with clear insights about software usage—and how efficient that usage is.
Here are three ways to use data to optimize your company’s internal software strategy:
1. Examine usage at the portfolio level
It’s best to first look at internal software usage at the portfolio level to see which applications employees are using and the amount of time they’re spending in each.
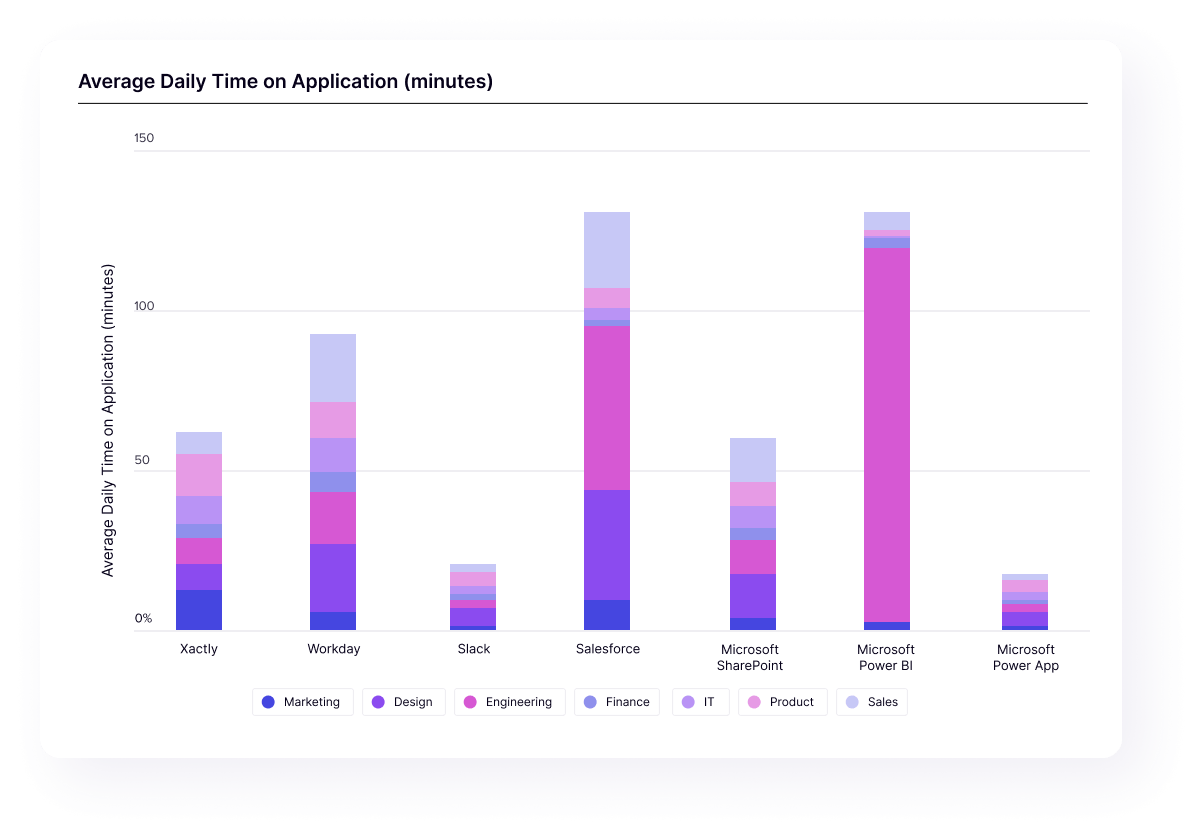
For example, you can examine different departments and see which apps they’re using most often and how they divide their time across your internal-facing portfolio. From there, you might choose to break down usage by application, or segment usage data by metadata or behavior.
2. Dig into license utilization
Once you have insights about the apps your employees are using, it’s useful to go one level deeper and consider license utilization. Does app usage fall within the bounds of your contracts with vendors and align with what you’re paying for?
Ideally, your digital adoption solution will let you set the number of licenses you’re contracted for and see what percentage over or under that usage limit you are within a particular time period.
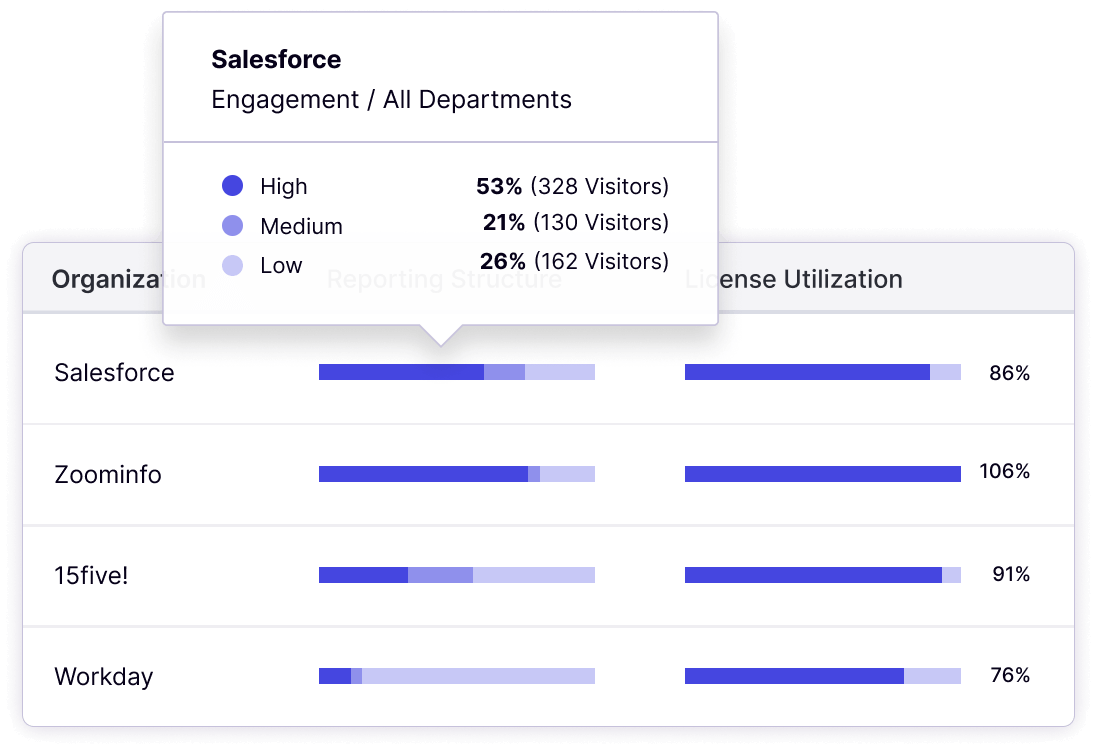
If you consistently see usage levels that are well under the license seats you’re paying for in an agreement, that’s probably a sign that you’re paying too much and should renegotiate your contract. On the flipside, having early knowledge of over-utilization empowers you to get ahead of the problem and proactively avoid penalization by your vendor.
Analytics can also help when it comes to software renewal negotiations. When you’re able to track usage for a given tool over time, you’ll be able to have more informed discussions around your company’s current utilization and whether you need to add more licenses, remove licenses, or stay with the same plan.
3. Look for signs of SaaS sprawl
As you examine usage data, keep your eyes peeled for signs of SaaS sprawl, which refers to a company’s uncontrolled accumulation of applications and tech spend. It’s a problem that hurts companies’ wallets through wasteful subscription costs—but it can hurt your bottom line indirectly in a number of ways, too.
As more and more apps are added to the stack, it’s almost inevitable that a business will unknowingly pay for two or more pieces of software that serve the same purpose. This not only leads to increased and redundant costs, but can contribute to process confusion and hindered productivity. These duplicative applications can also cause a lack of standardization, increased security risks, challenges with app integrations, and fragmented data.
As is usually the case, the first step in solving your SaaS sprawl problem is admitting you have one. With product analytics data, teams can analyze app usage by segments based on department or geography and better detect duplicative software and the related issues.
Ready to learn more about optimizing your organization’s internal software usage? Take Pendo and Mind the Product’s free Digital Adoption Certification Course.