It’s never been a better time to be building digital products. 54% of product professionals say their organizations have implemented or will accelerate implementation of product-led growth. And 43% of companies are hiring more product managers. Yet, at the same time, it’s never been more turbulent. From AI and macro economic challenges to PLG and remote work (just to name a few), it feels like there’s always something waiting to shake up your roadmap.
A not-so-secret weapon to help product teams rise to the occasion? Data. The ability to capture insights from quantitative and qualitative data is the most frequent common denominator among the best product teams. It’s hard to find a product manager who doesn’t agree with this—but just as hard to find one who thinks it’s easy.
Today, product teams are swimming in data, most of it noise. As product people ourselves, we want to make sure Pendo helps and doesn’t just add to this problem. This idea is the sentiment behind all the advancements we’ve made to Pendo Analytics over the last year. We want to deliver you the most powerful product analytics possible, while still making it easy to use and simple to sort signals from noise.
Let’s dive in.
Go deeper: Get answers to your most pointed questions
Great insights come from asking great questions. But if there’s no way to answer those smart questions—what’s the point? To help, we’ve expanded the depth of data available within Pendo Analytics so you can ask and answer your most pointed questions.
Track user information over time with historical metadata
User metadata changes over time. Yet, many analytics tools only report on recent user activity—freezing your data in time. Track the entire history of user behavior, so you can get more accurate user intelligence with answers to questions like:
- Has a specific plan level grown over time?
- What are users doing in trial?
- How does behavior differ by plan?
Custom reporting in Data Explorer
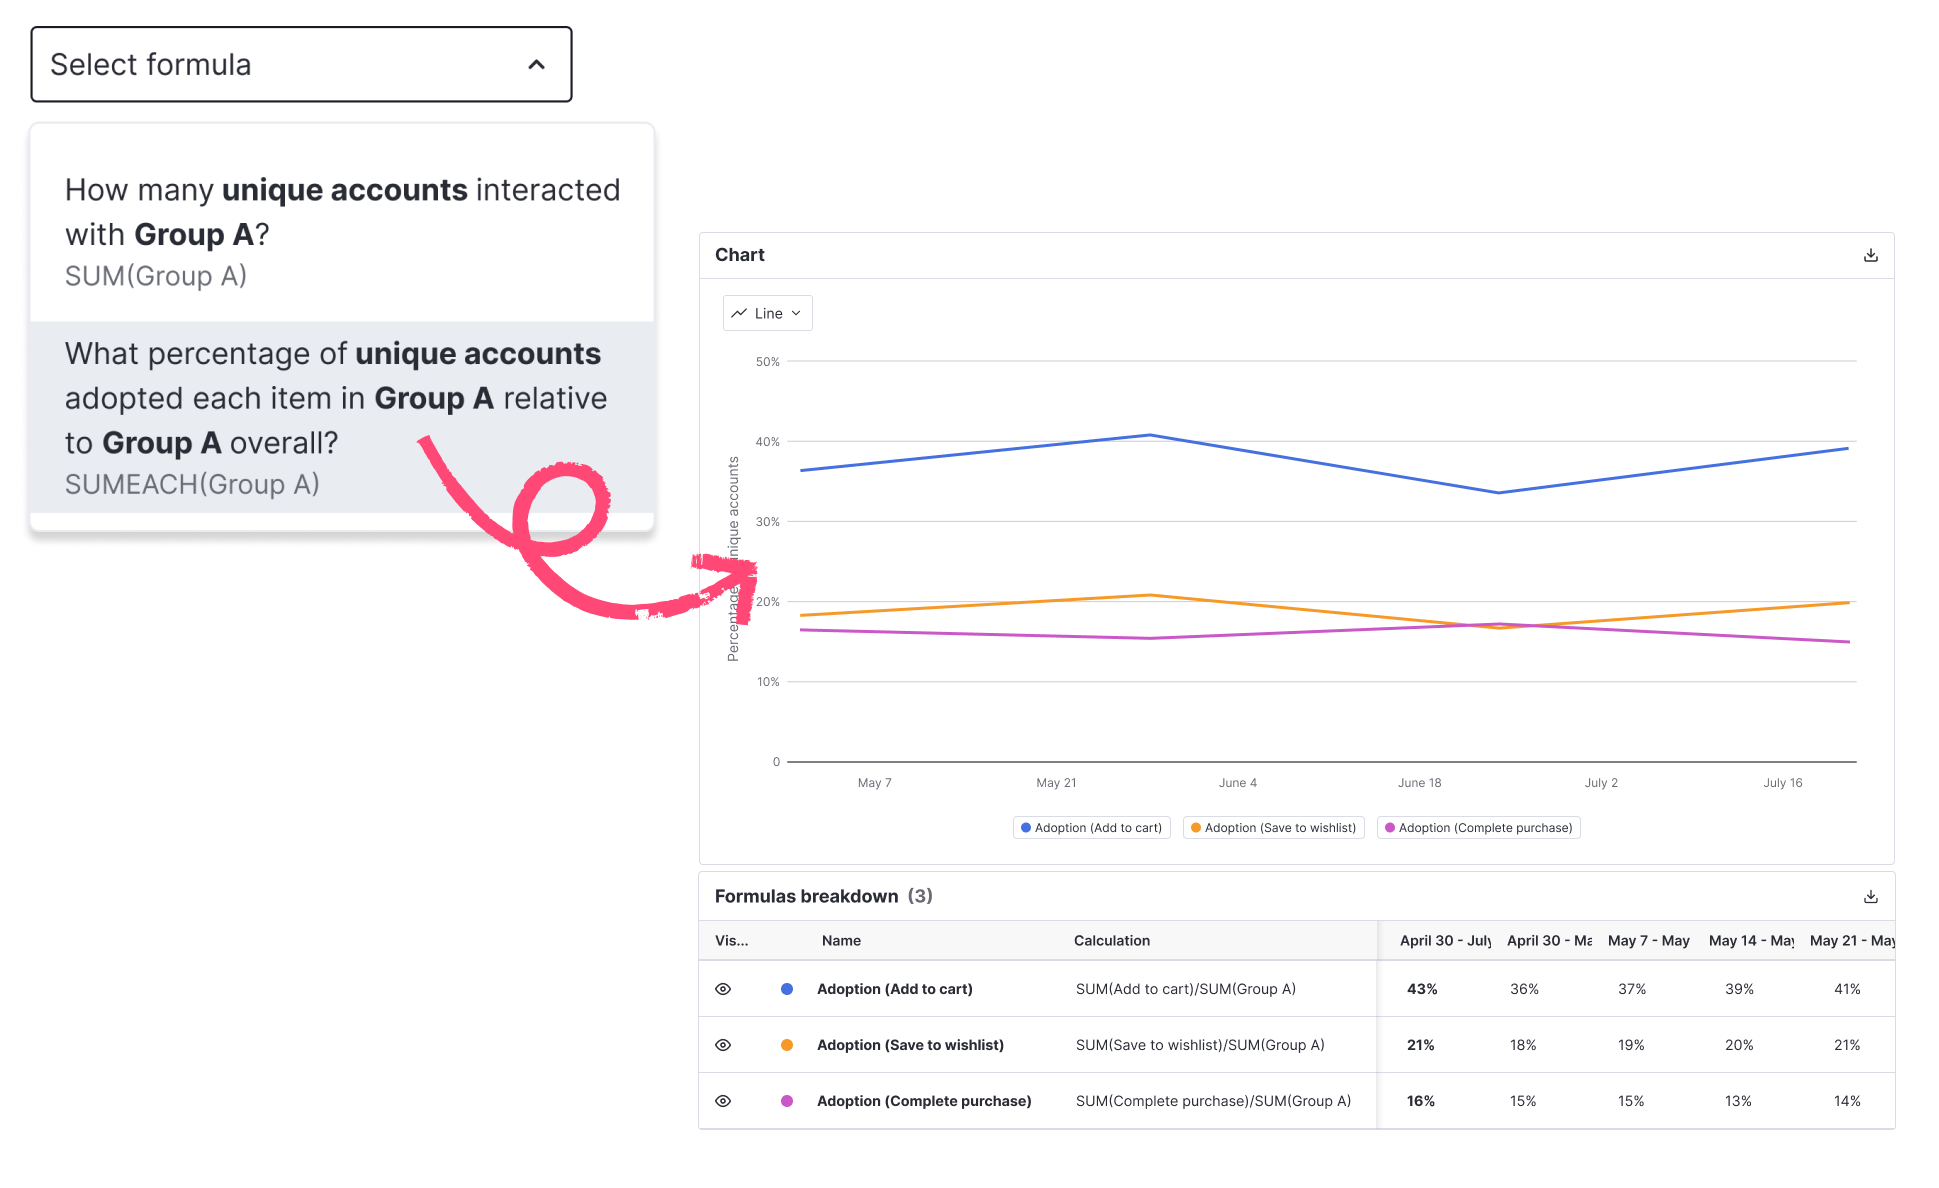
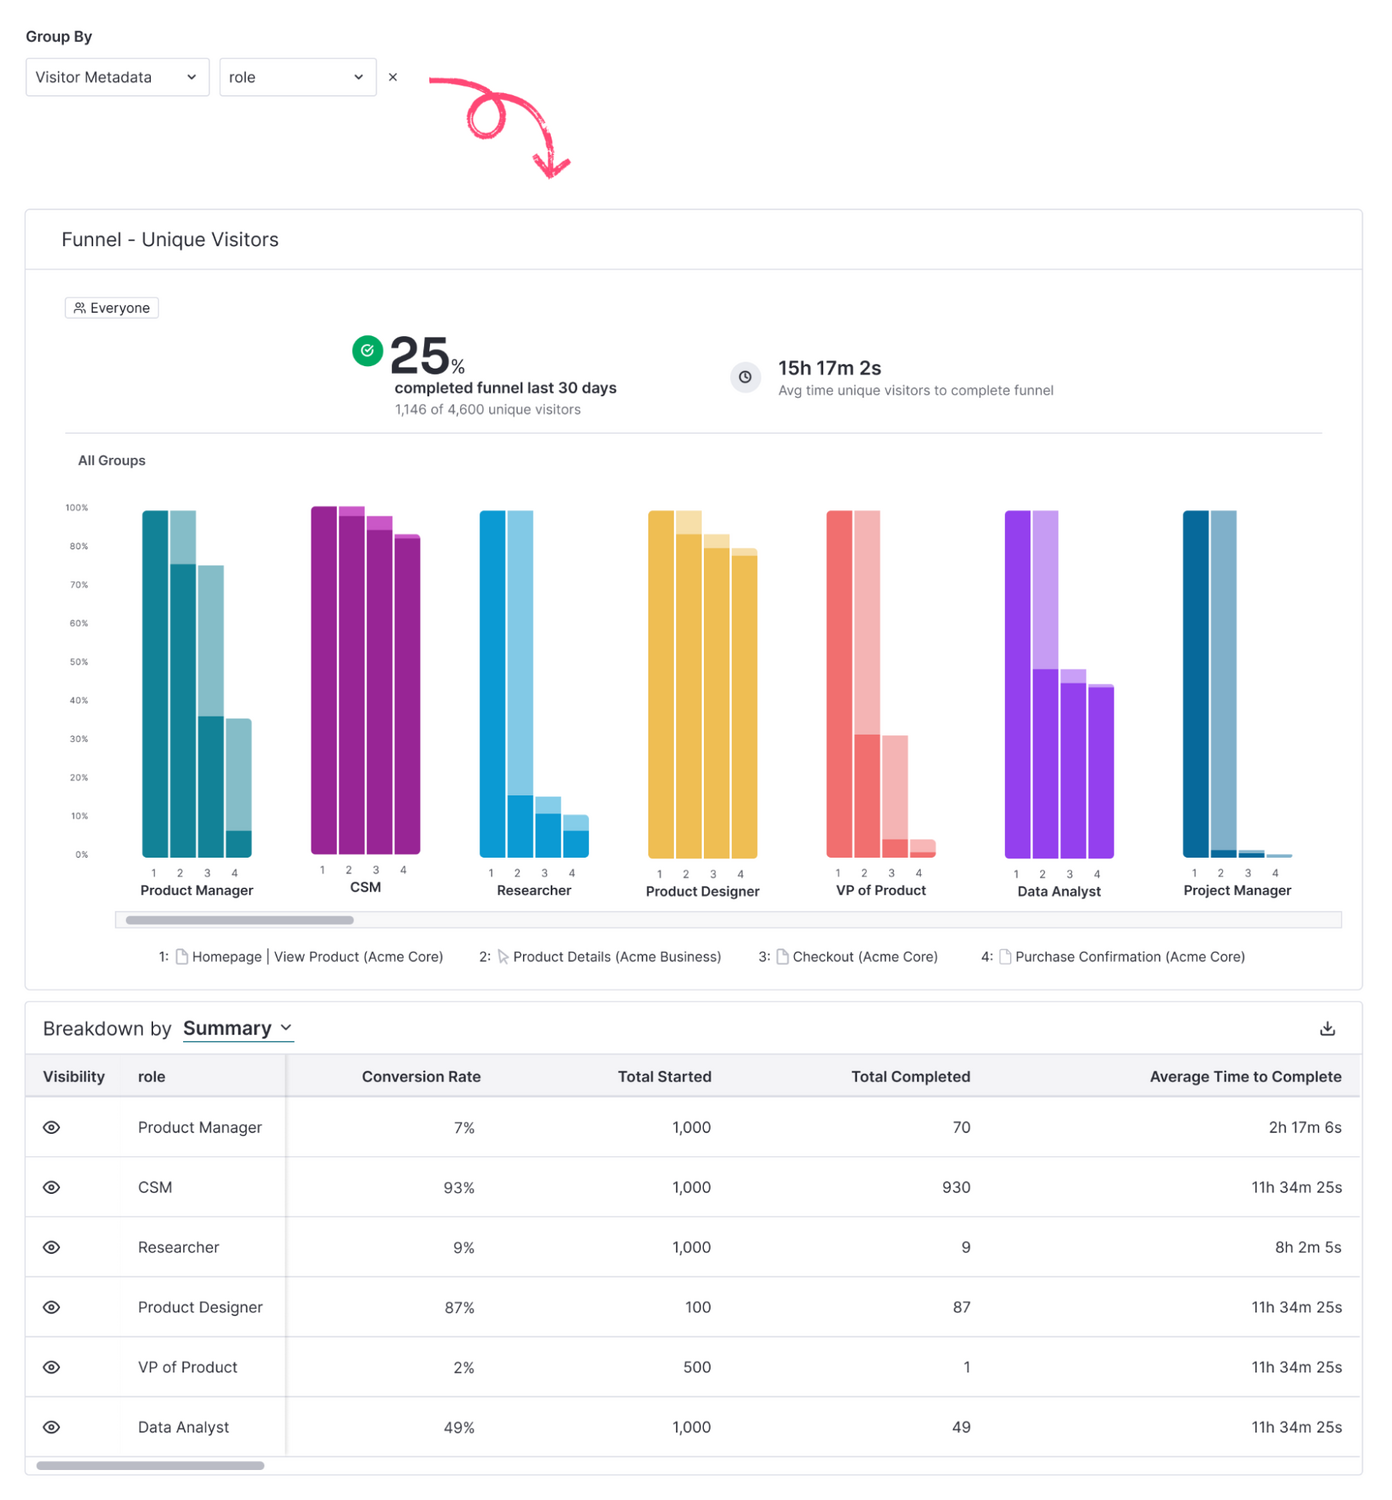
Data Explorer provides custom reporting to help you ask and answer product usage questions specific to your business. With new ways to cut the data (such as by device type, event properties, and report-level filters), you can build custom reports with richer data faster. Plus, new capabilities like formulas enable you to track adoption with more precision; and multi-dimensional group-by allows you to conduct more complex analysis across different visitors—both without ever having to open a spreadsheet.
Go faster: Easily act on signal from the noise
Simplified reporting is crucial for getting to the right answers quickly. We’ve introduced several innovations to our out-of-the-box dashboards and user journey reports to make tracking progress and understanding results straightforward.
New widgets and usability improvements for dashboard reporting
Bring critical data and insights into the spotlight so it’s easy for your teams to find signal in the noise. With updates to existing widgets, like Time-to-First-Use, it’s simpler to get an at-a-glance understanding of how your product is performing. Plus, with widget resizing and sticky filters, it’s not only easier to use but easier to customize dashboards to fit your needs.
More sophisticated user journey reporting
Go to the heart of where users get stuck with exciting updates to funnels—from visual design enhancements and unique visitors counts to grouping by visitors and integrations with Session Replay. Plus, with the addition of workflows with journeys coming soon to Analytics, there’s even more ways to visualize how you can best support users to find value faster. And that’s just what’s live today! Coming soon: The addition of guide events, conversion rate over time, pin to dashboard, and more.
Go further: Smarter, more actionable insights across your entire org
With simpler and more intuitive reporting now in Analytics, not only can you and your teams find signal in the noise faster, but so can your stakeholders. It’s all the rich information you and the rest of your company needs to maintain growth velocity. From marketing to sales to customer success, anyone can run reports and make decisions quickly without waiting in a data analysis queue.
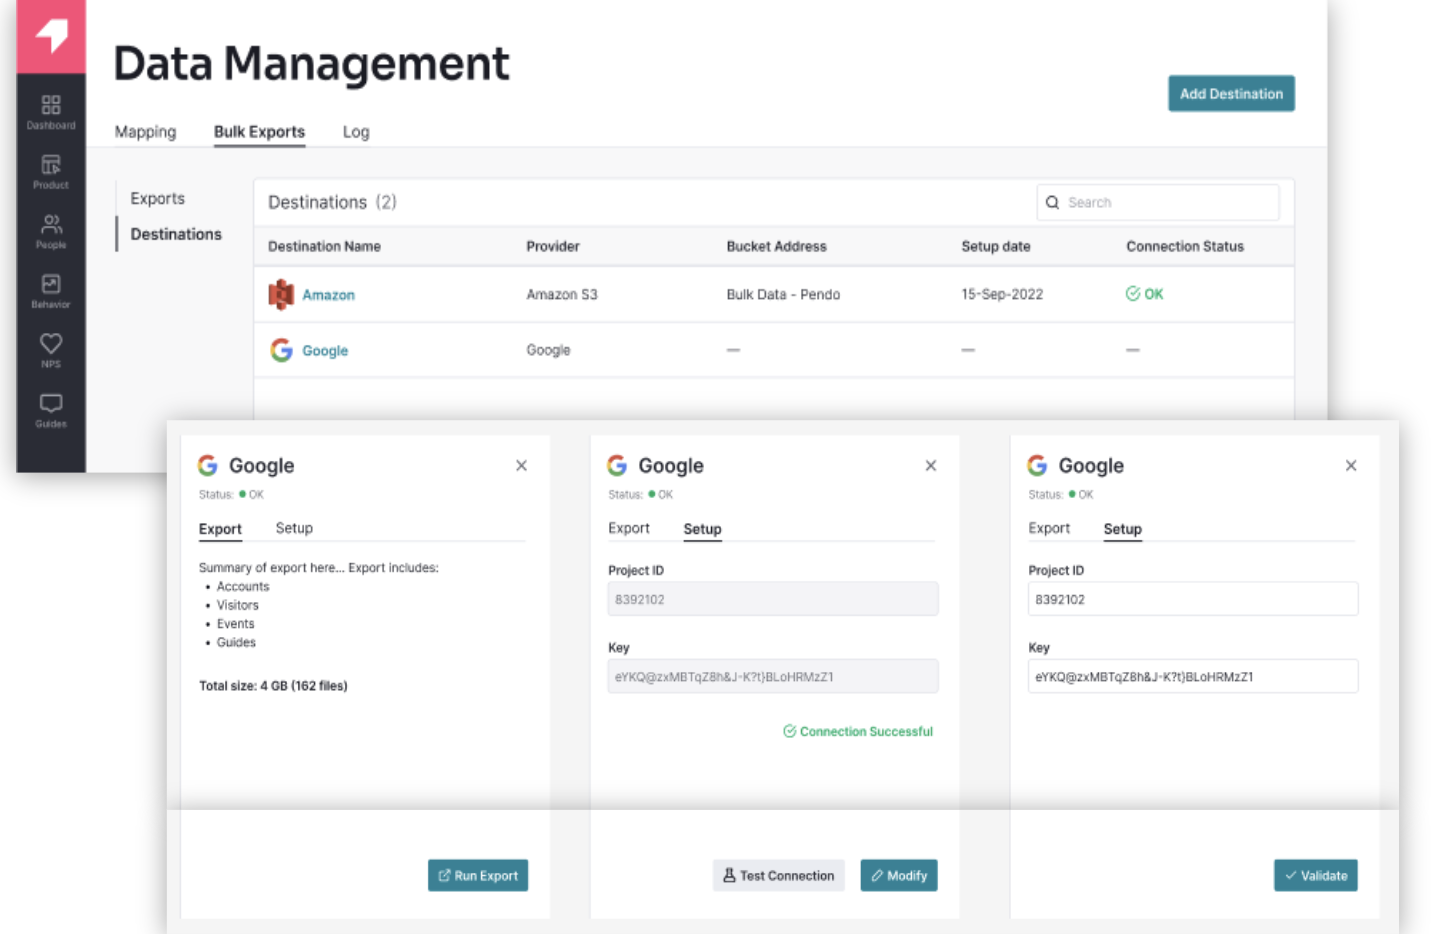
And if your company prefers to share data via a warehouse, we’ve got you covered there too. With the addition of Data Sync, it’s simple to get all the data you want and need into a central location for data teams to easily leverage and act on. Connect the dots between user behavior data and data across marketing, sales, and customers success to prove how product improvements and investments drive sales, increase customer loyalty, and protect against churn.
Keeping pace with your curiosity: What’s next for Analytics
Great product teams never lose their curiosity. Here are all the ways we’re building to satisfy your current (and future) questions—quickly.
- Map and measure the full, end-to-end customer journey: User journeys don’t really begin at sign-up. They start way back at that first website touch. Understand the full customer journey and start at the beginning with reporting that can measure how customers go from visitors to users, supercharging your product-led growth.
- Reporting that zooms in on specific parts of your applications: Measure what matters. Focus on only those areas of your product that you and your team are responsible for.
- Working smarter, not harder, with AI: Imagine leveraging the power of machine learning to surface insights and alerts without manual effort. With an assist from AI, you could find signal in the noise faster and focus first on mission critical moments within your product.
The dynamic landscape of modern product management requires innovative tools and strategies. Pendo Analytics is at the forefront, empowering product teams with rich analysis capabilities, streamlined reporting, and actionable insights to navigate the challenges and seize the opportunities that lie ahead. Stay curious, stay data-driven, and stay ahead with Analytics.
See what’s new in Pendo Analytics today.