Product pros often focus on measuring a product’s success, but diagnosing how and why a product isn’t meeting the goals you set is that much harder. We rolled out the product engagement score (PES) to help product leaders understand product performance and how to improve it. Today, we’re introducing PES drilldowns to help PMs take measurement even further, allowing teams to dig deeper into their product engagement score and identify areas for improvement across each component–adoption, stickiness, and growth.
Each drilldown details how the metric is changing over time and helps answer the question: Is my product improving? If the answer is “no,” product teams can begin to zoom in on the “why” through the corresponding charts and data for each metric. Let’s take a look at how to use the data from each drilldown to identify areas of improvement and develop new tactics to increase PES effectively.
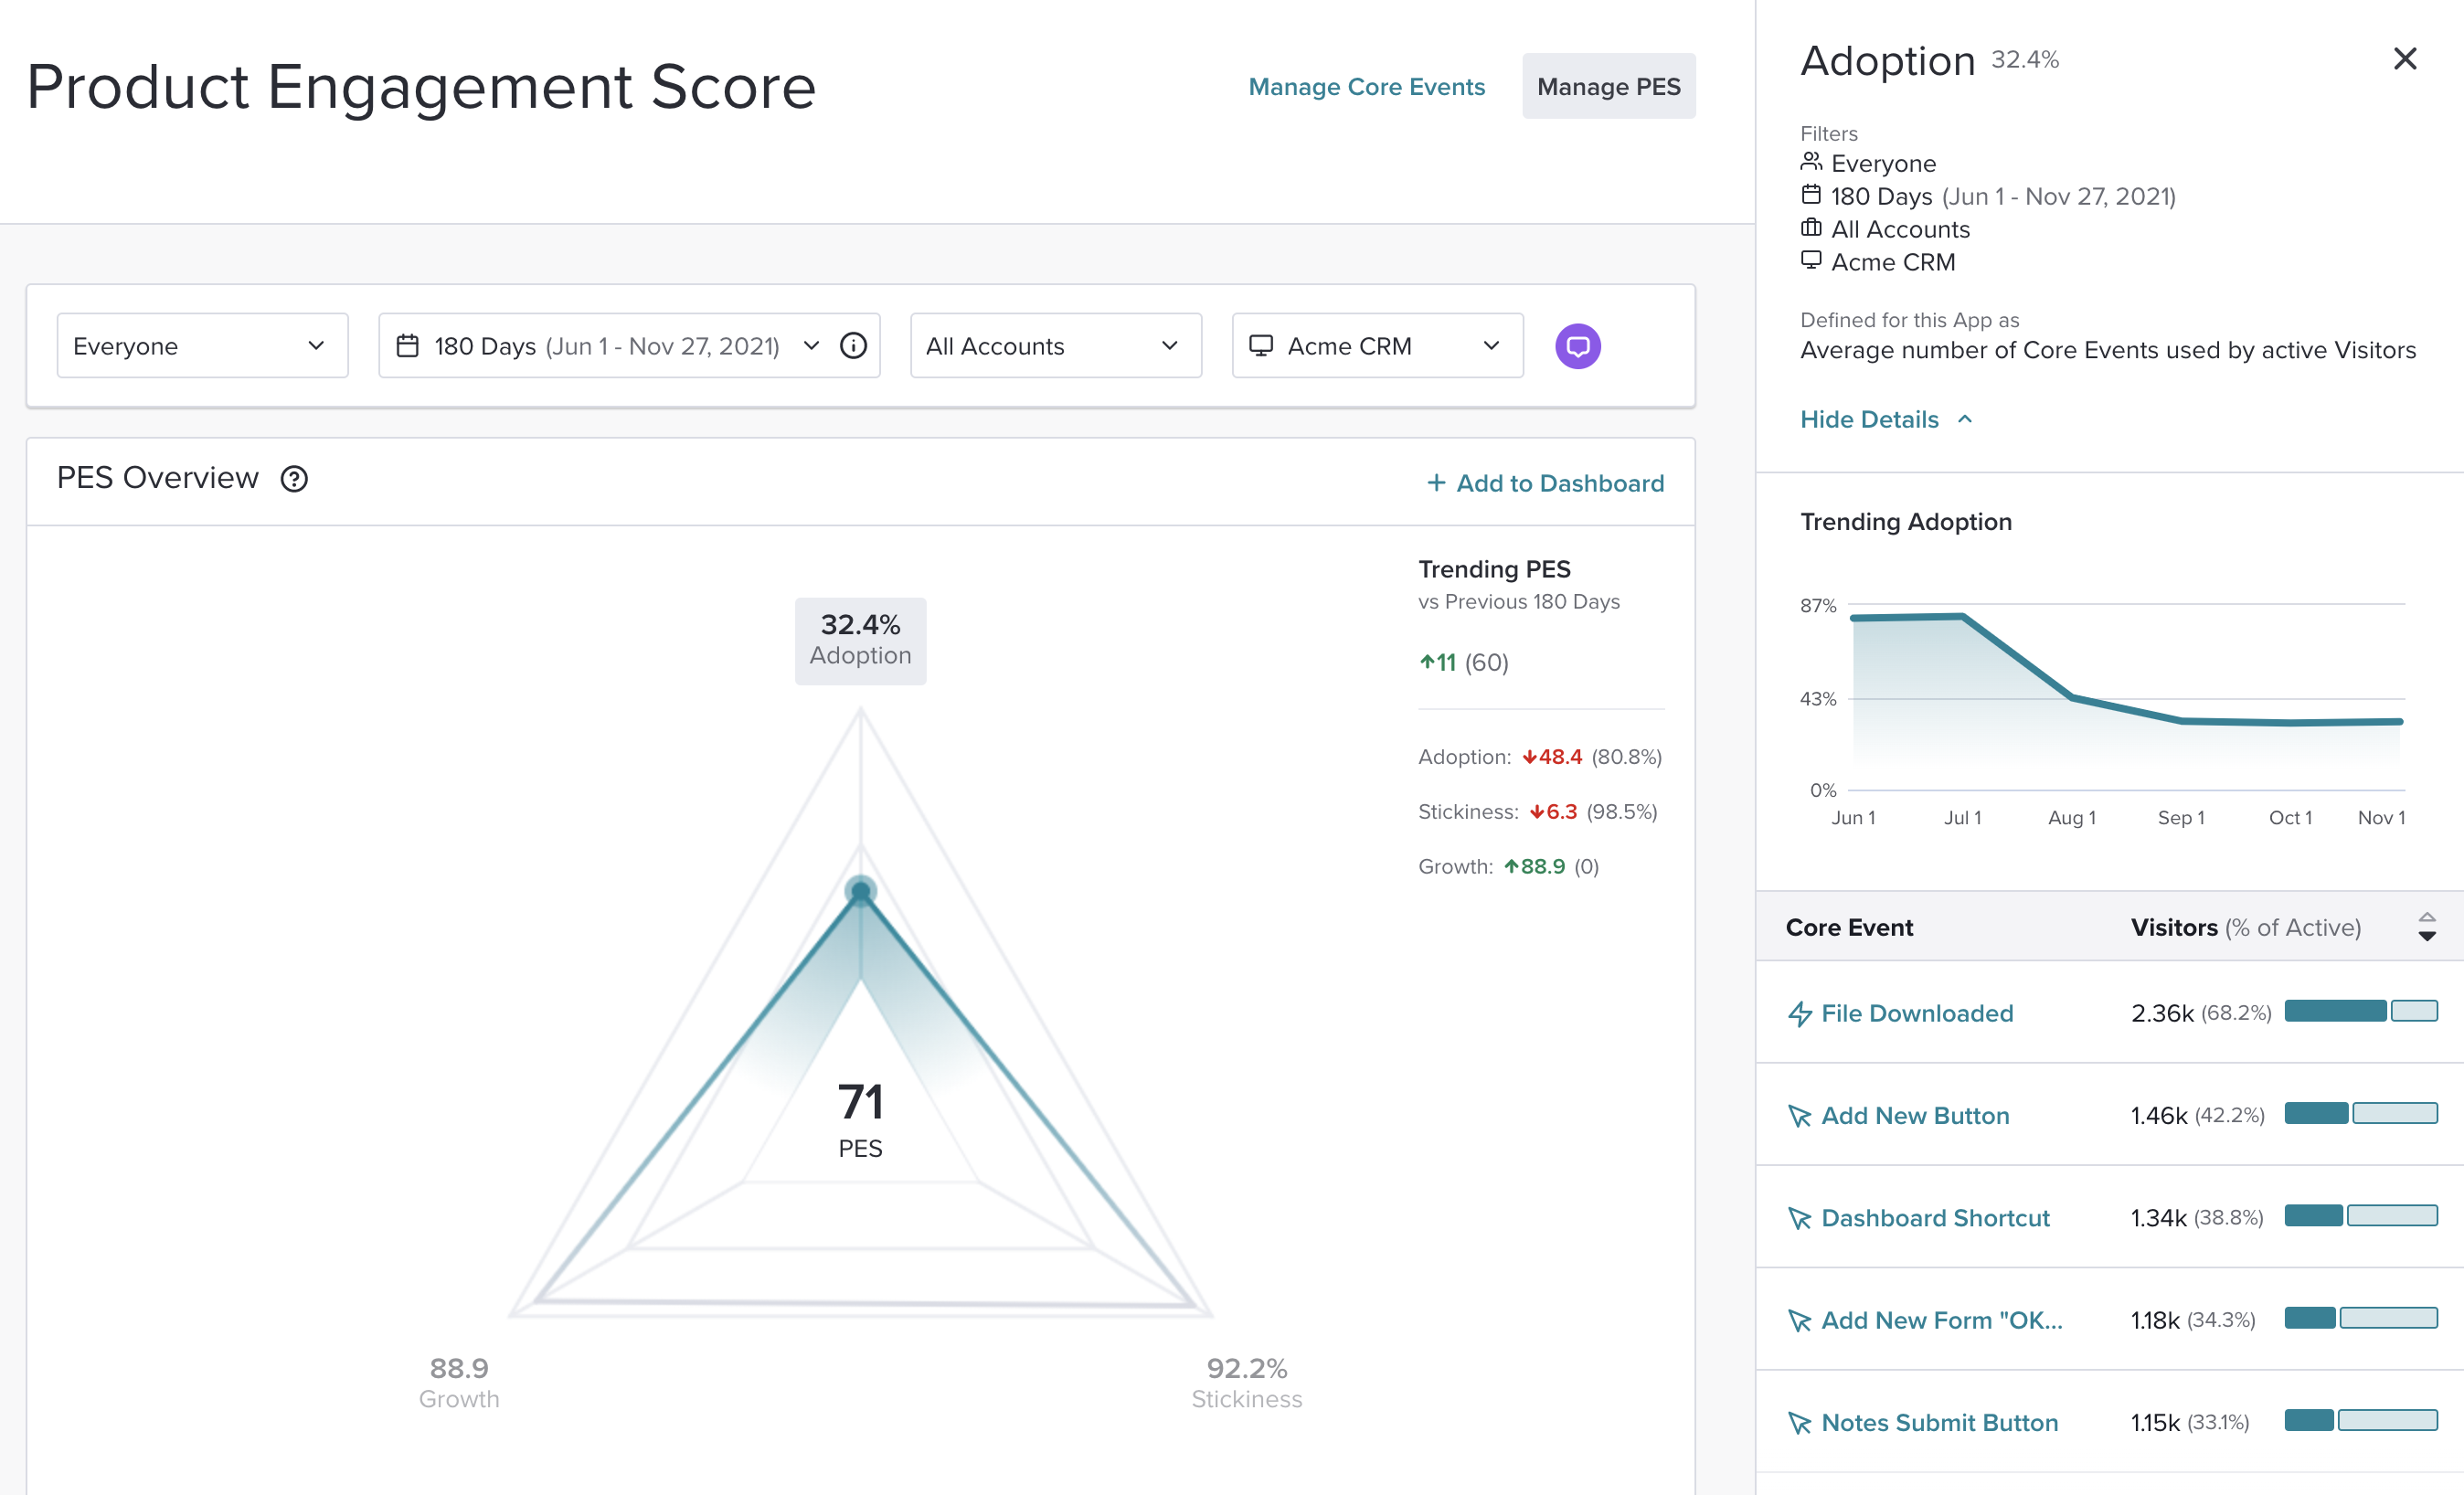
Adoption: Examine adoption rates for each key feature
In PES, adoption measures usage of a product’s specific key features (aka Core Events). Adoption is necessary for product success because it articulates if–and how quickly–people are finding value in your product. For PES, we calculate adoption by taking the average number of Core Events adopted across all active visitors or accounts in the selected date range. The adoption drilldown offers a deeper look at adoption trends over time and how users are interacting with each key feature you’ve identified.
In the adoption drilldown, the “Core Events with Visitors/Accounts” table displays a snapshot of how visitors or accounts are interacting with each configured Core Event. The trending graph shows the trend of adoption within the given time period.
As you interpret this data, your product team may want to ask these types of questions:
-
- How many of your active users are interacting with Core Events? If interaction with Core Events is low, users may be experiencing difficulties finding these key features. What tactics can you explore to improve discoverability?
- Are these key features worth recognizing as Core Events? Perhaps interaction is low because the selected Core Events are not high-value features for users.
- Are the selected Core Events related to onboarding, since we know that is a crucial part of the user journey? Onboarding is usually a great place to start when selecting the right key features.
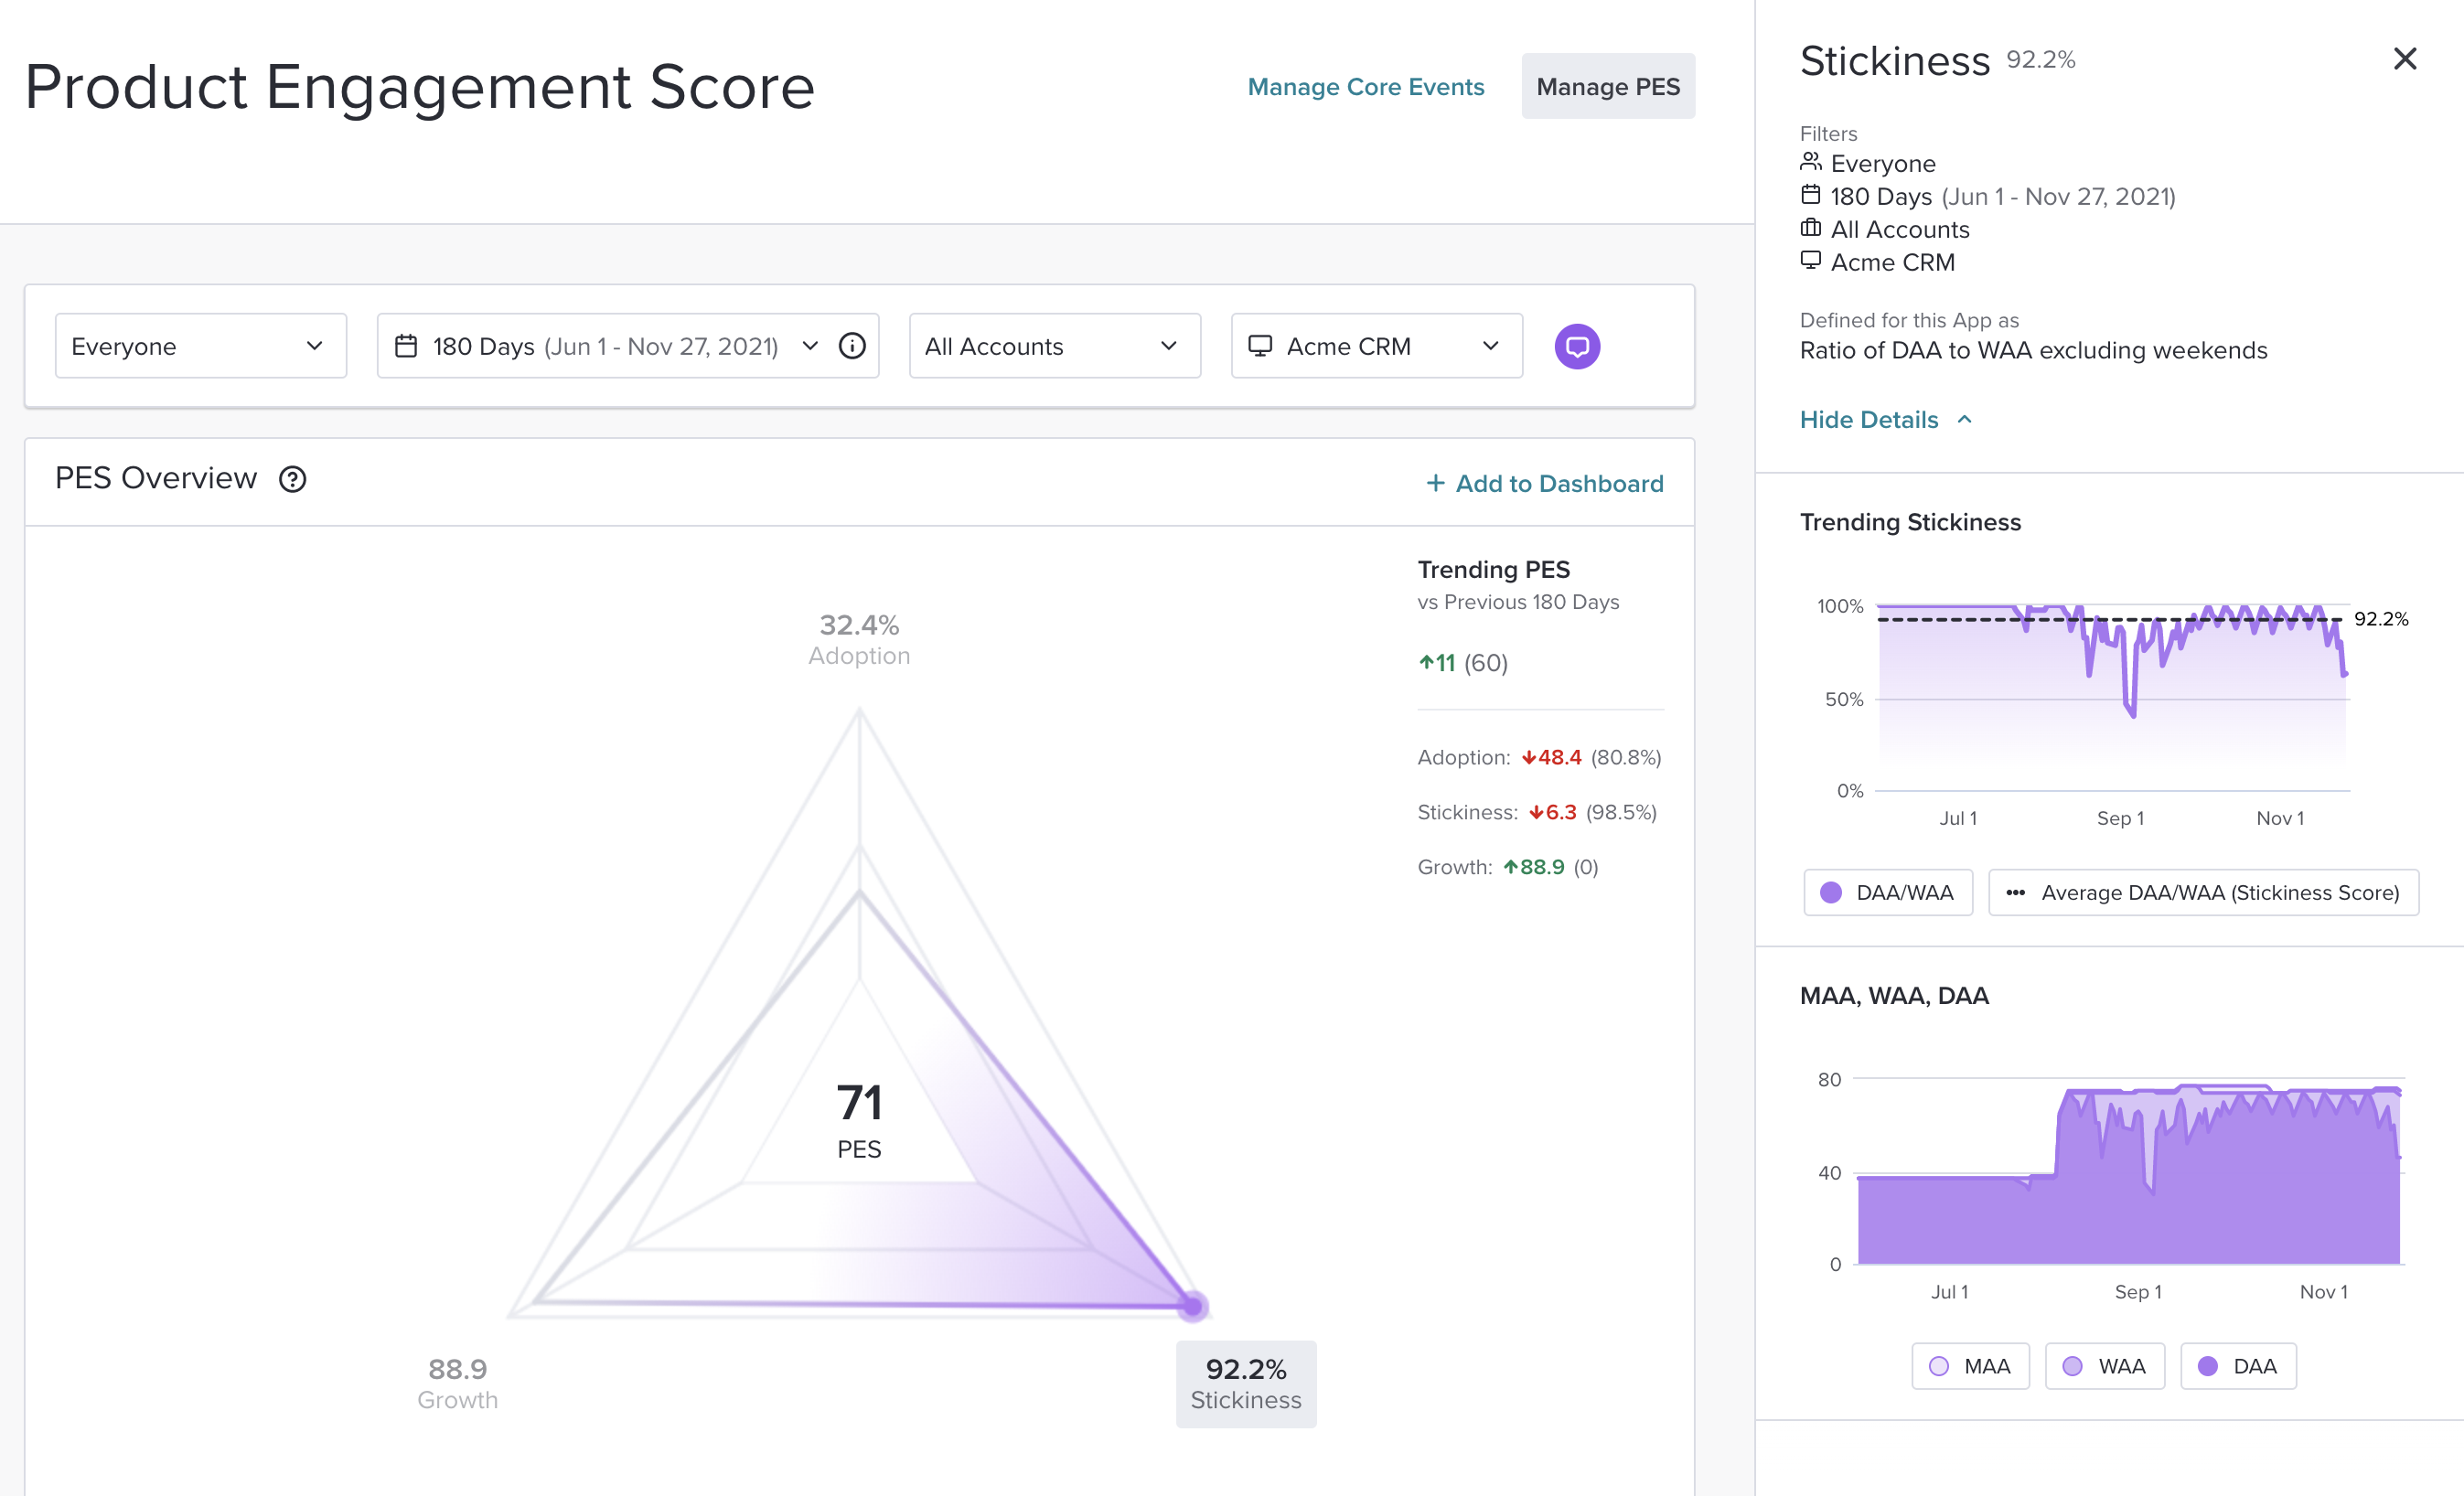
Stickiness: Measure user return rates
Stickiness measures how many users return to the product on a regular basis. A sticky product piques user interest by delivering consistent value and is so engaging that users are compelled to visit it regularly. When a product is sticky, users don’t just sign up and log in occasionally–the product becomes part of their daily professional lives.
The stickiness drilldown helps you understand stickiness trends and the corresponding breakdown by total users or accounts. There are three ways to measure stickiness for your product engagement score:
-
- DAU/WAU: the percentage of weekly users who engage with your product daily
- DAU/MAU: the percentage of monthly users who engage with your product daily
- WAU/MAU: the percentage of monthly users that engage with your product weekly
By looking at the trending stickiness chart, you can see the trend of stickiness within these given time periods. With stickiness, you always want to increase the ratio–more specifically it’s important to maintain an increasing numerator.
Here are some questions you can ask yourself when digging into your product’s stickiness:
-
- Is your stickiness ratio increasing over time? Use the trending chart to understand how your ratio is increasing or decreasing over time.
- What are the behaviors of your high-frequency users? What outcomes and workflows drive more frequent interactions with your product?
- If applicable, why are there extreme dips in the chart? Take a deeper look into why this is happening, and then try to diagnose.
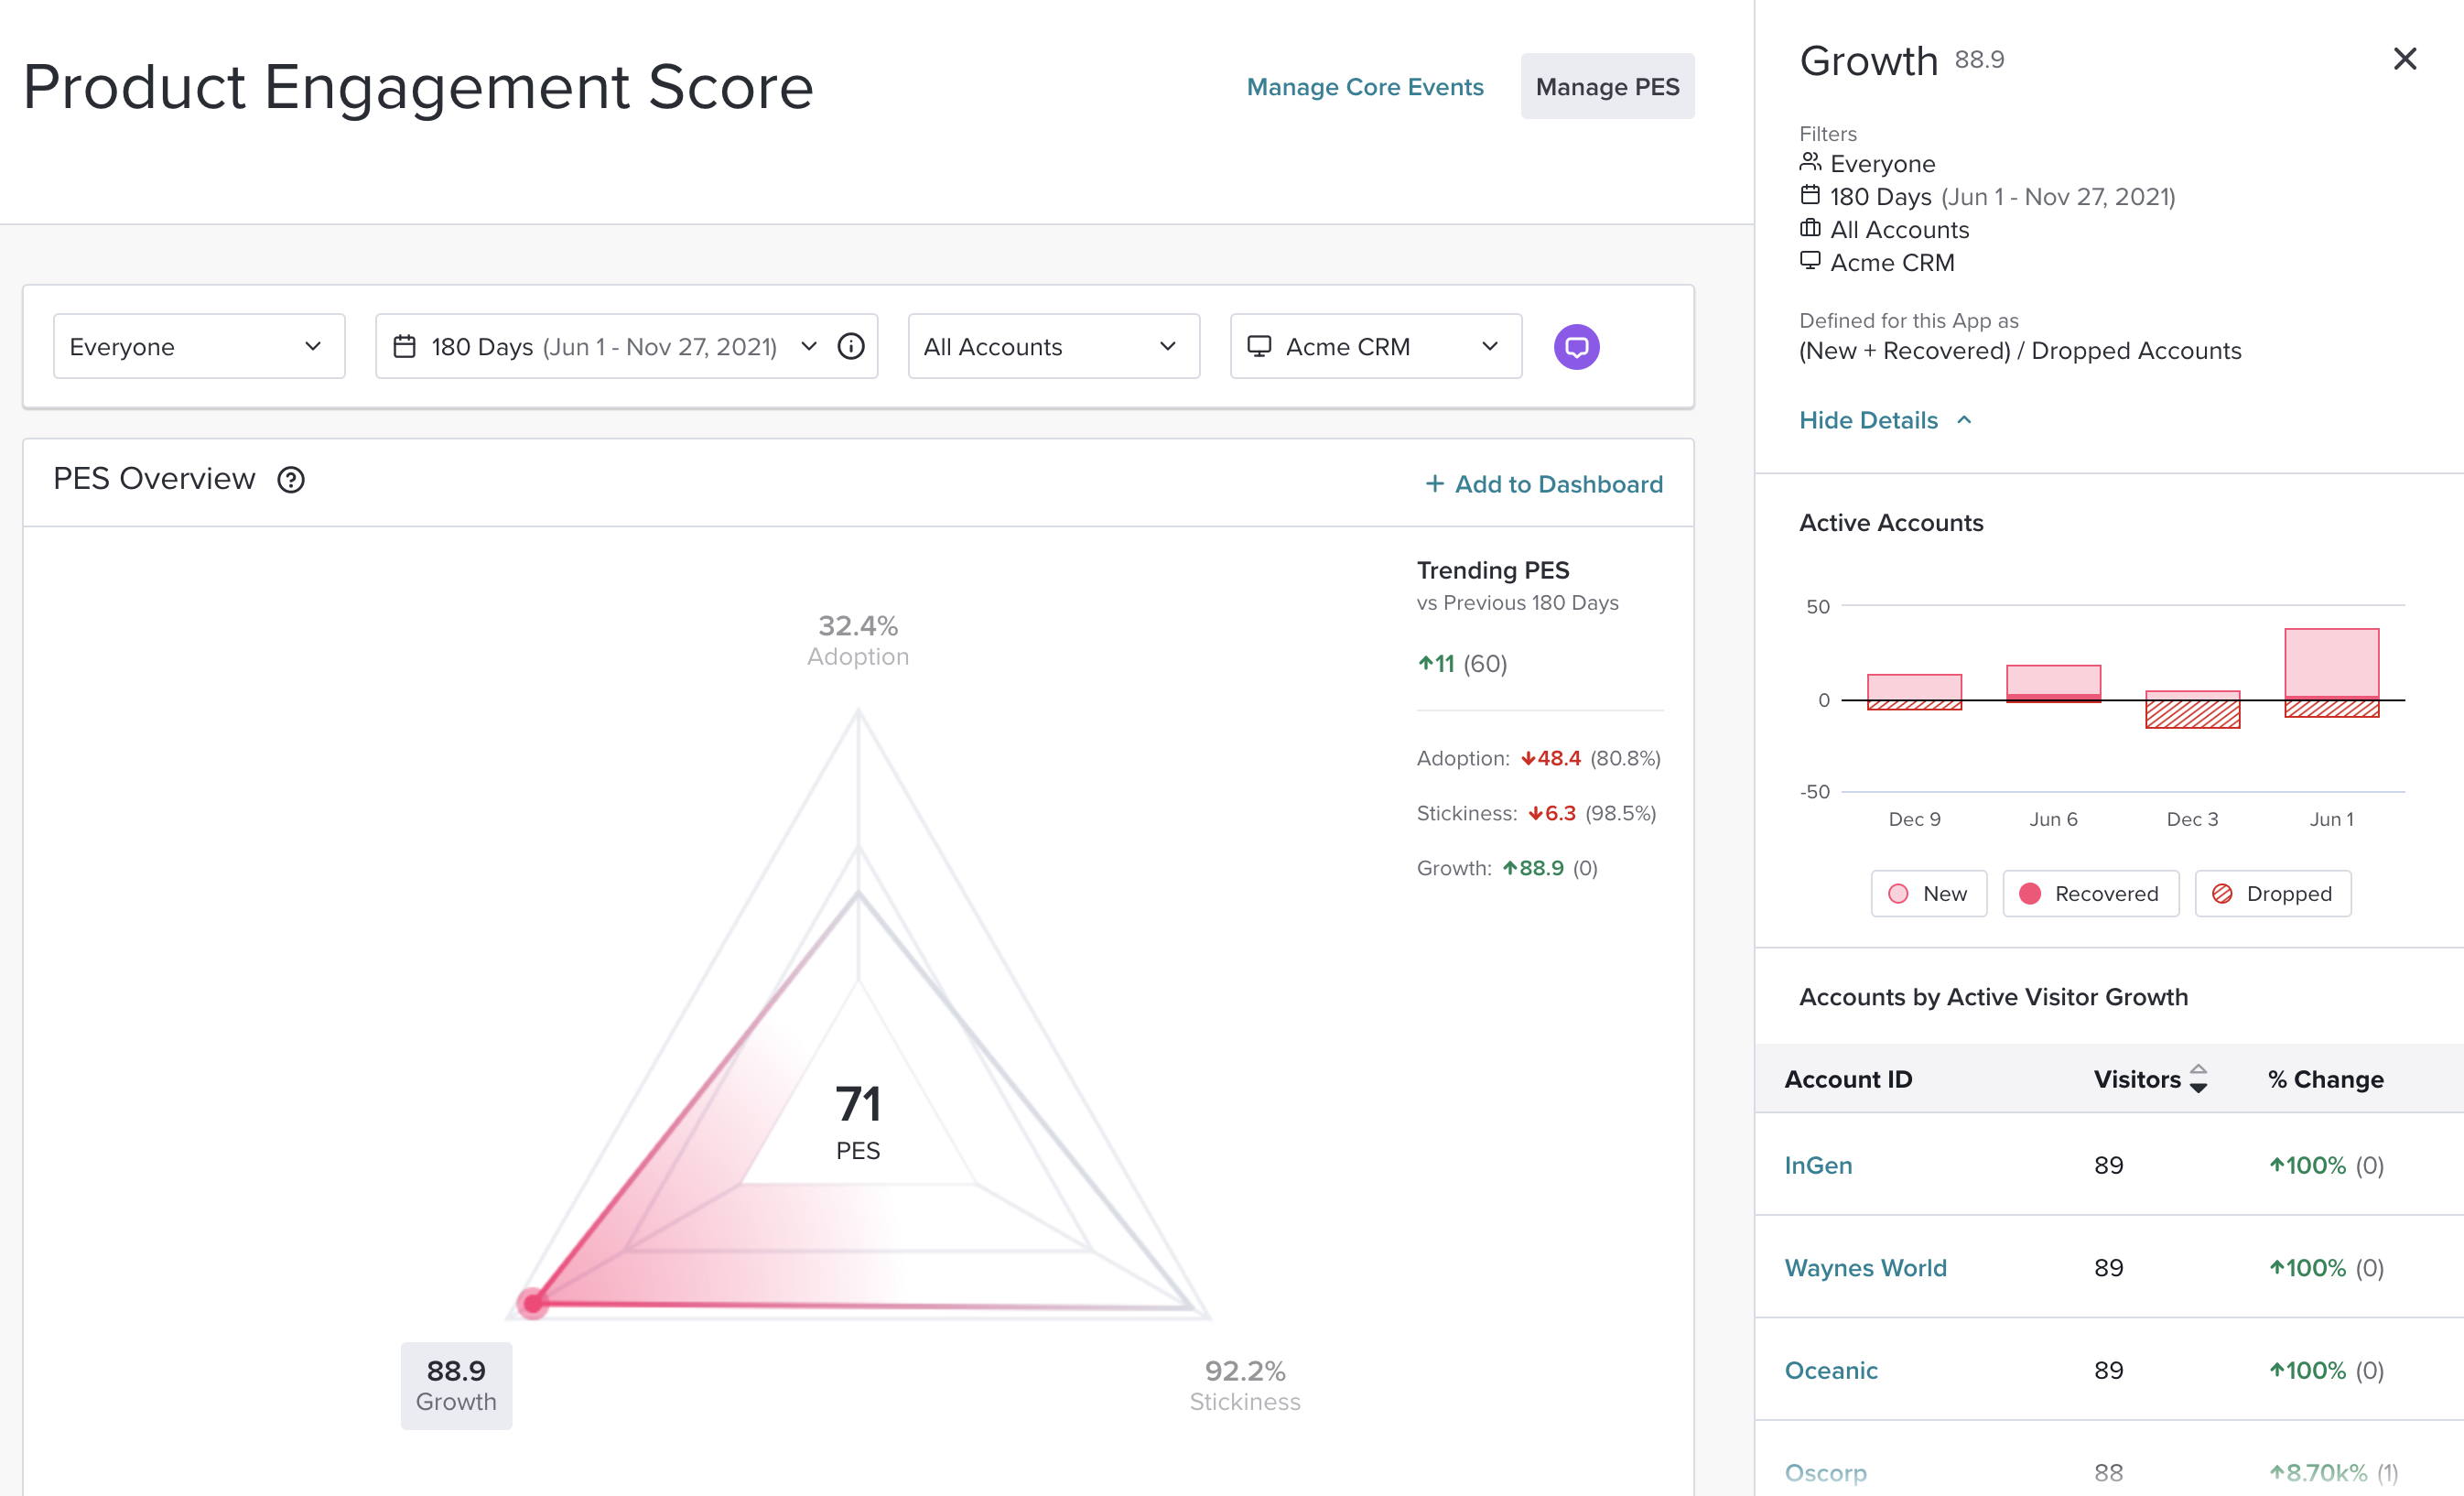
Growth: Understand user growth over time
Growth measures the change in your active account or visitor count over time. Think of growth as a popularity contest–the more people like and engage with your product, the more popular you become. There are two important charts that dig into how growth is trending over time, including one that shows how growth by account is changing over time. This data allows you to pinpoint which accounts are exhibiting less activity overall and, more importantly, begin asking why.
As you interpret your growth data, consider asking these questions:
-
- Are you struggling to add new users, or is it a matter of maintaining the ones you have now?
- What accounts are displaying low/high growth rates?
- If there is a significant decline or increase in growth rates, what is the context behind these changes? Find out if any seasonality or account-specific events are impacting large swings in growth.
Whether you are focusing on one PES metric or all three, drilldowns empower your team to upgrade the way you interpret the performance and health of your product. Remember: building a great product that delivers on its promise to users is an iterative process. With drilldowns, we hope product leaders feel better equipped to take a data-driven approach to optimizing their product engagement over time.