Must read
December 11, 2025
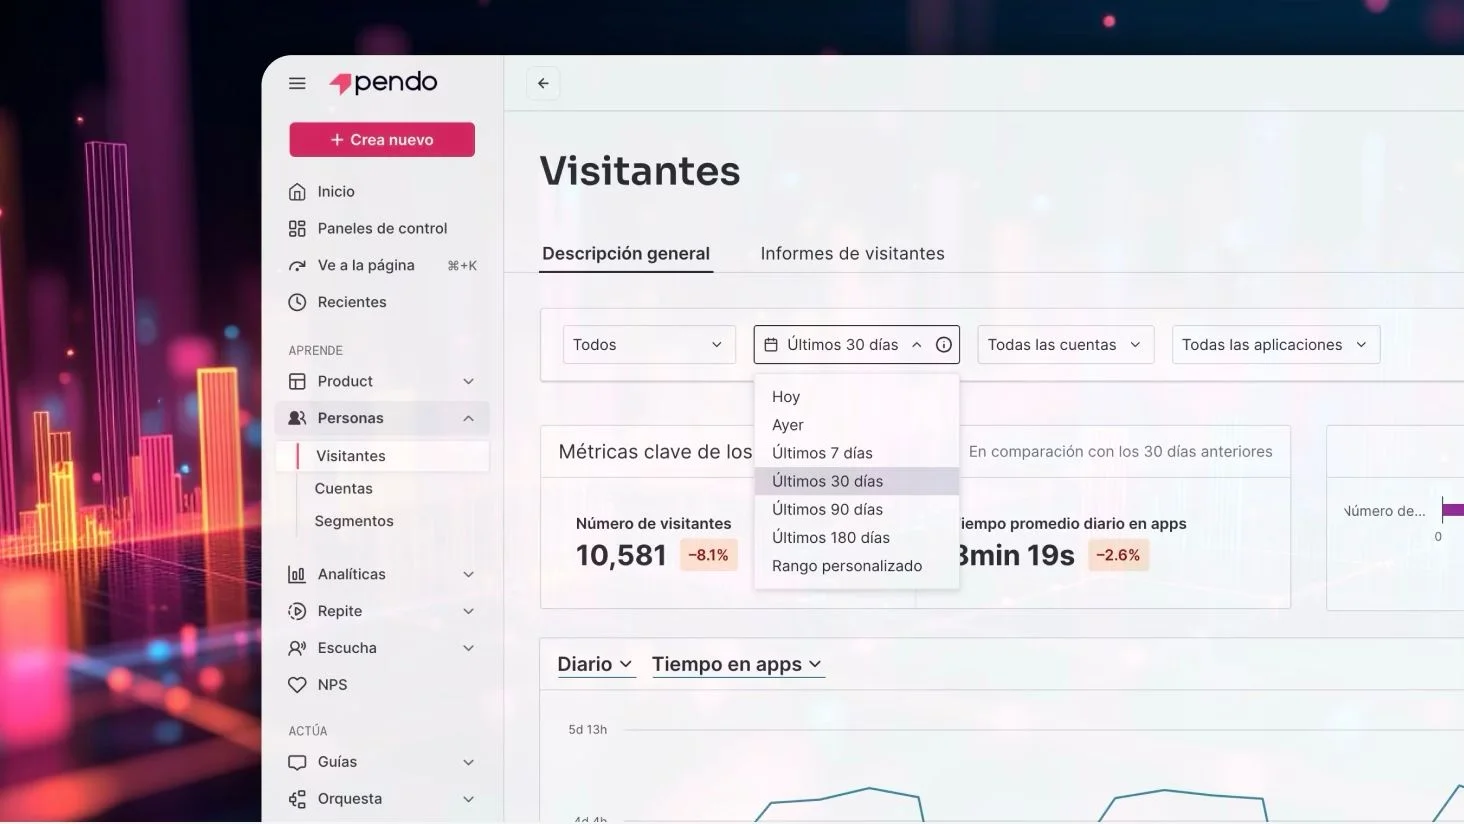
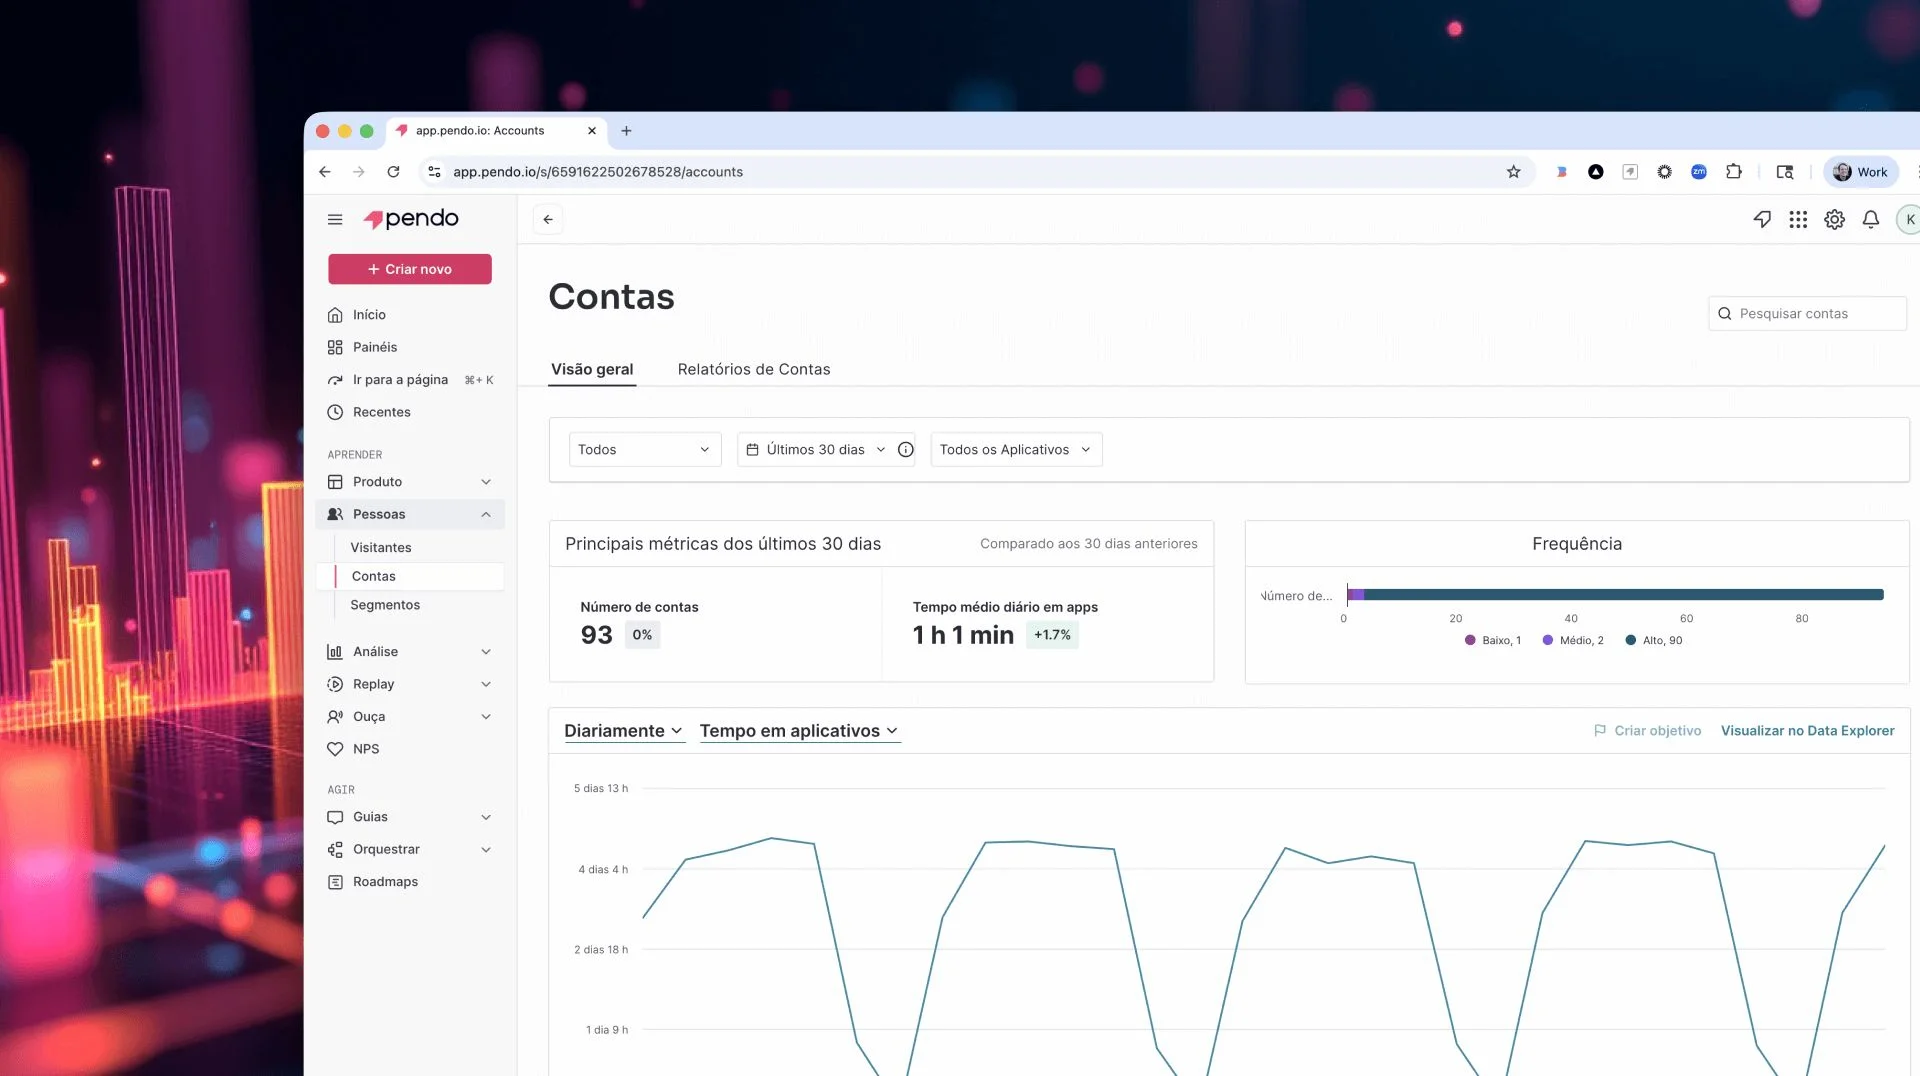
Portuguese is one of the world’s newest tech power languages. And now, Pendo speaks it.
From São Paulo to Lisbon, Luanda to Maputo, Portuguese-speaking markets are experiencing a surge in digital innovation.
Read nowLatest
News –– 3m read
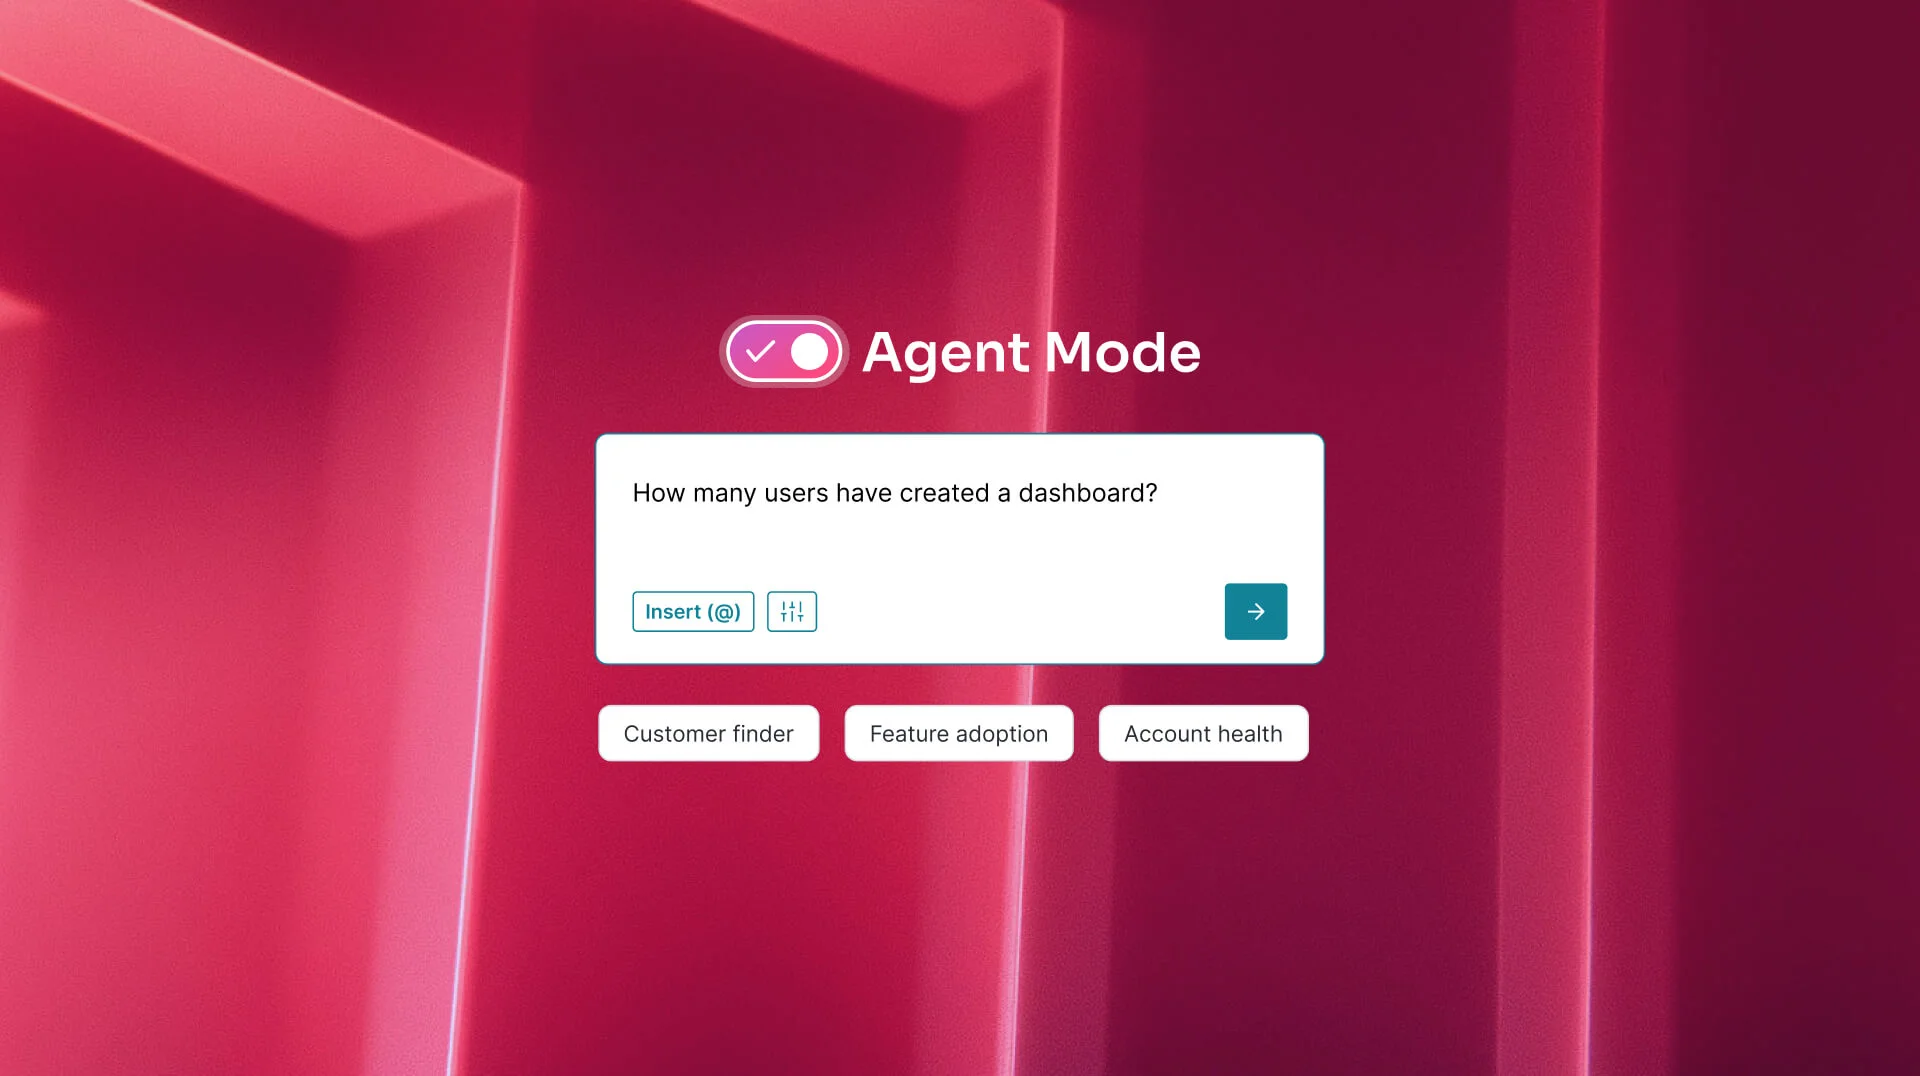
Announcing the Pendo MCP Hackathon
Watch now
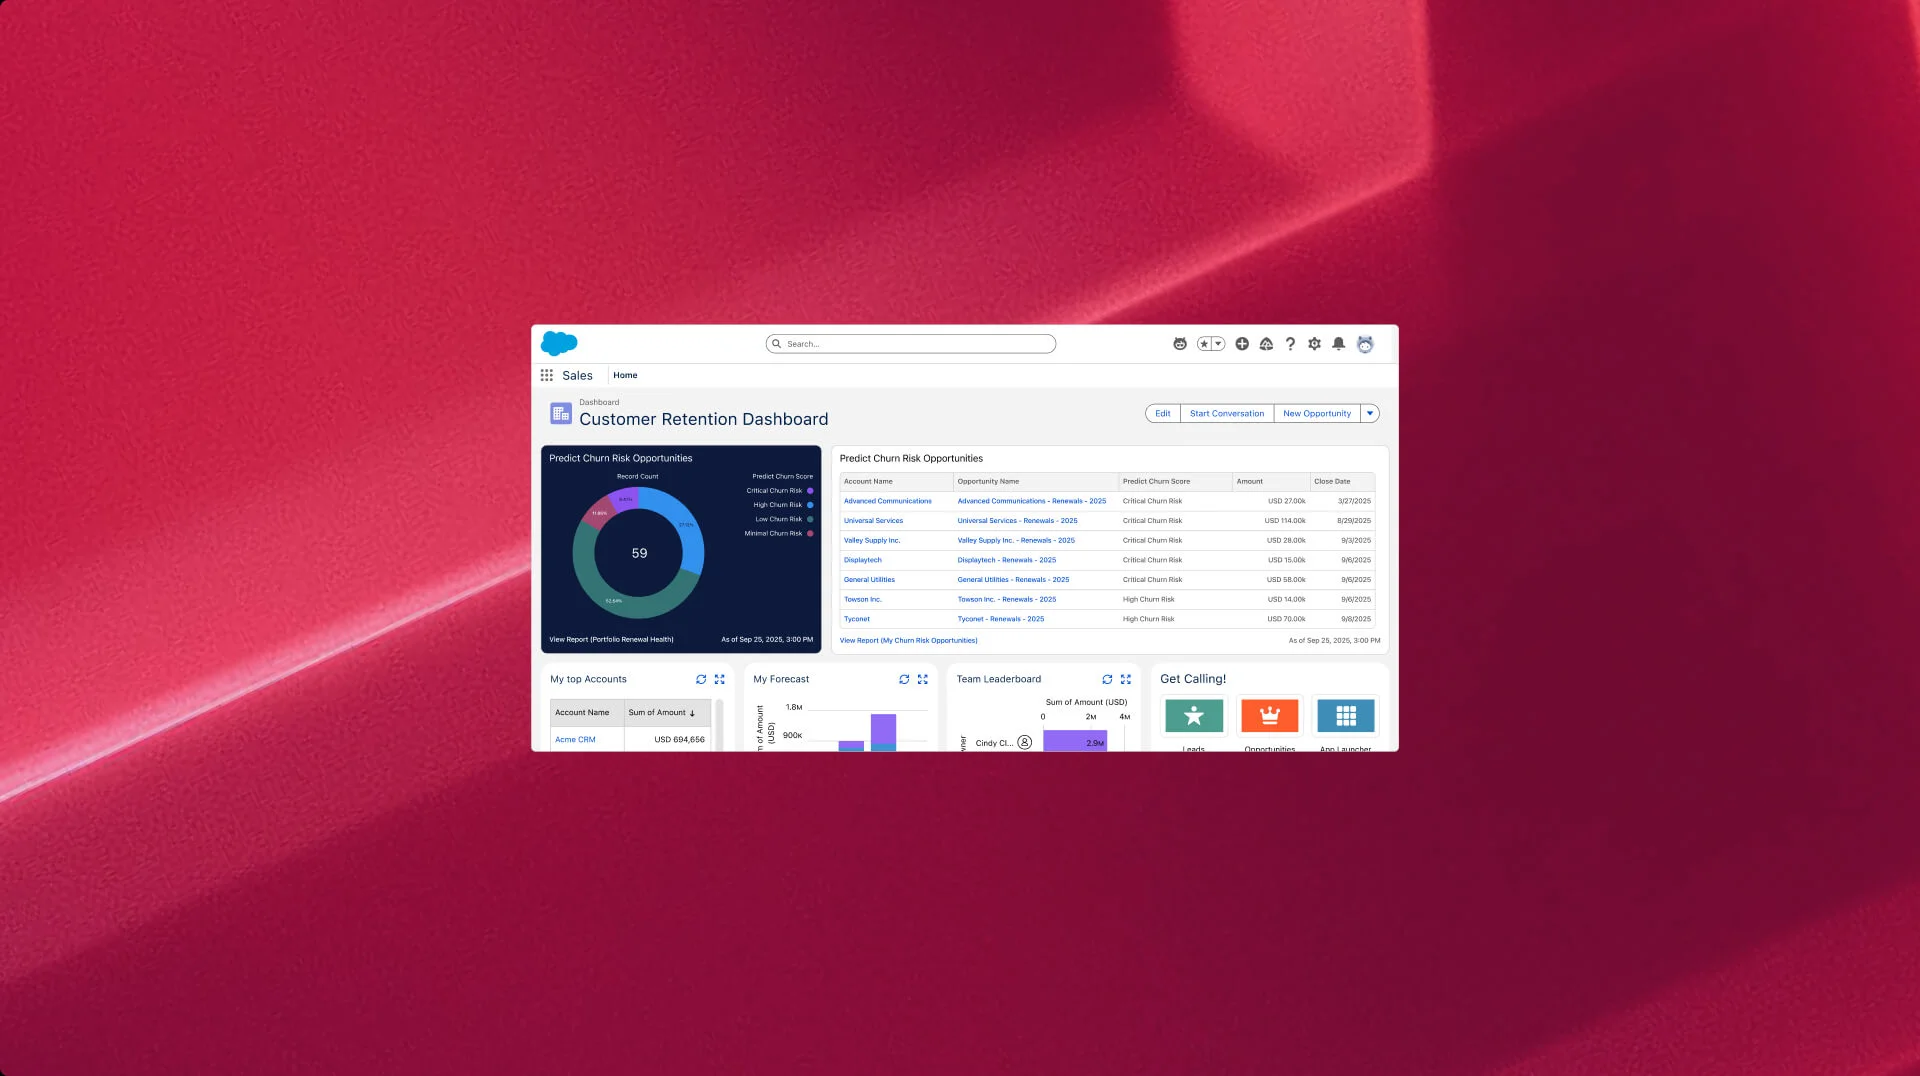
AI-powered churn prediction at scale
Sneha Raghavan, VP of customer success, talks about the power of Pendo Predict and how it uses product signals to directly impact revenue outcomes.
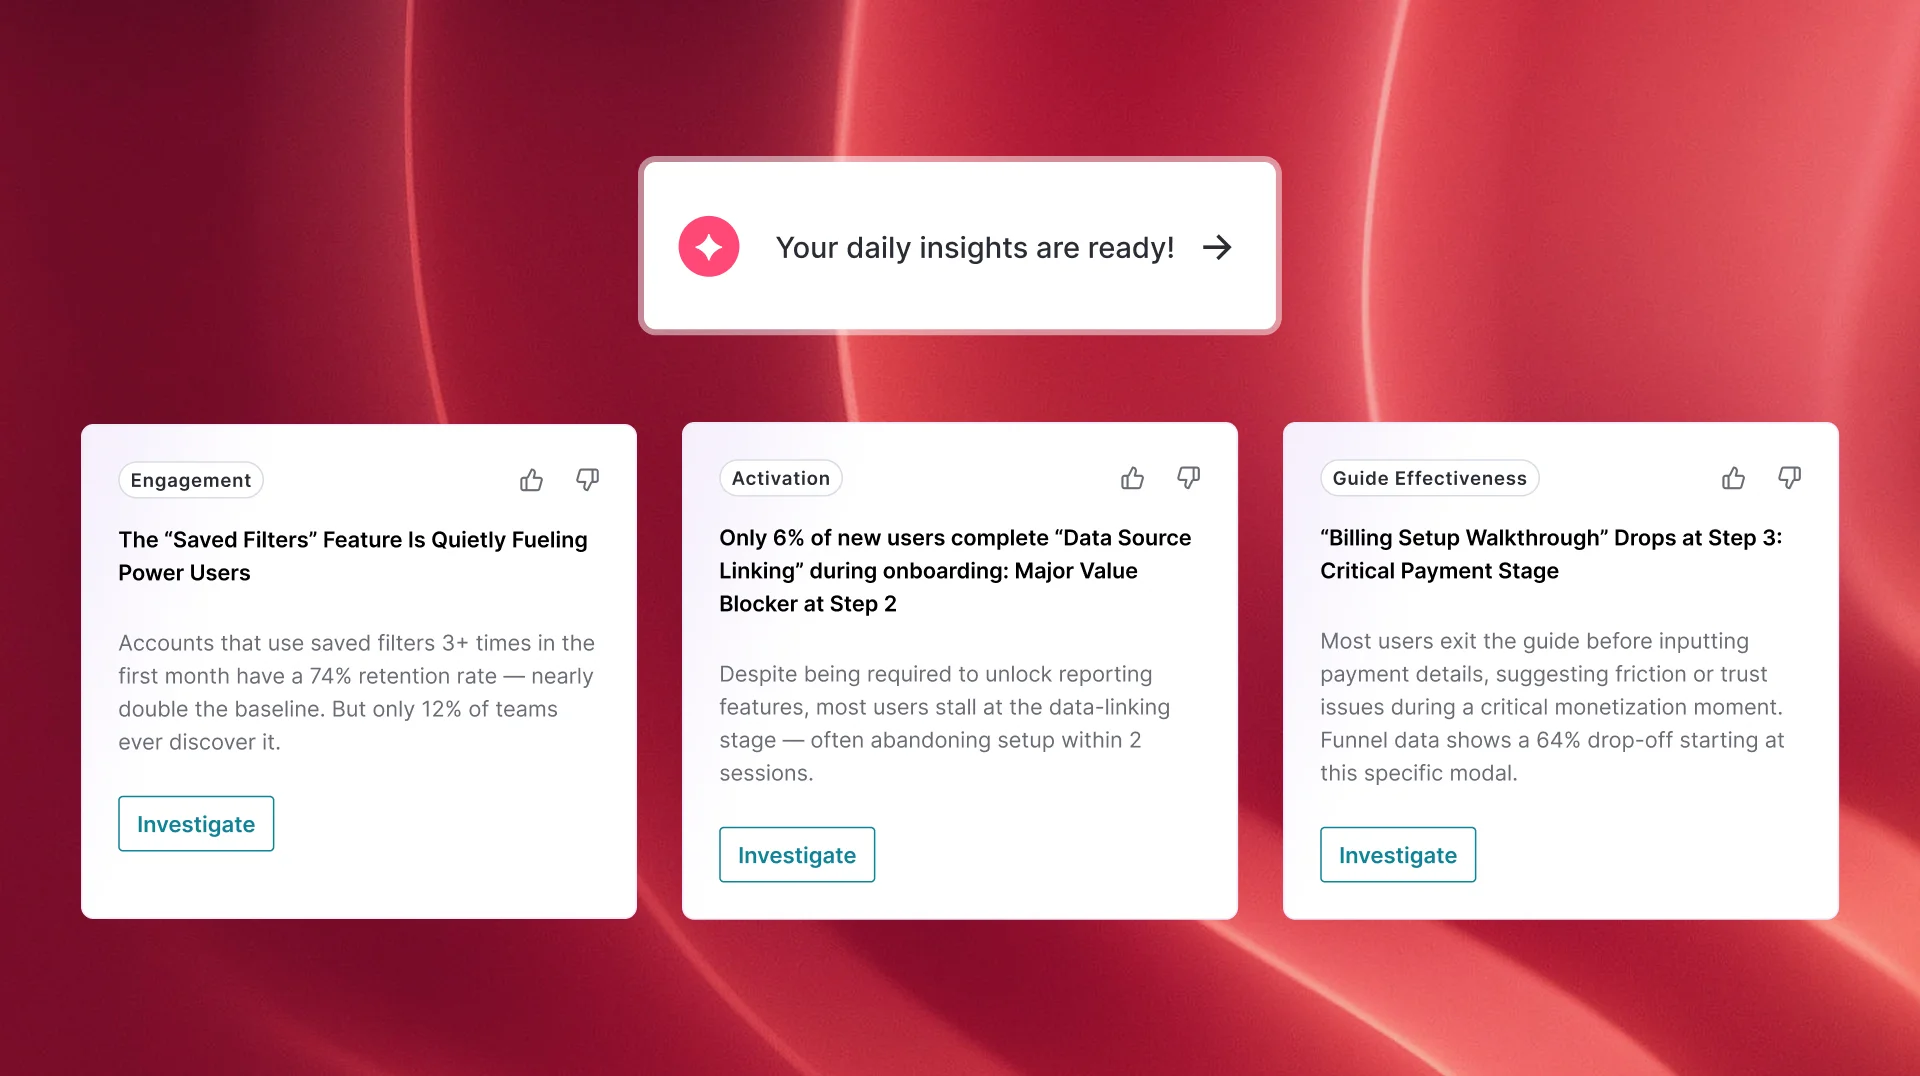
Read about itGet to know Pendo
See Pendo in action and learn how Pendo teams use our own product to optimize our customers' software experience.