Some might argue that the Net Promoter Score (NPS) is oversimplified — and therefore an ineffective metric — but executives, investors, and VCs continue asking for it, and companies continue measuring it.
No matter which side of the NPS debate you fall on, there’s no denying that word of mouth is powerful, and an important growth engine for technology companies. NPS is especially useful for digital product companies, since they can easily deliver in-app surveys (which users are more likely to fill out) and pair scores with usage data for more in-depth product insights.
But when we think NPS, we often only think about comparing scores with our own past scores. This internal benchmarking is valuable, but you also need to consider how your NPS compares with other companies that are similar to yours. In other words, a “good” score is all relative.
Breaking down NPS by industry
In addition to comparing your score to scores of similar-sized companies, it’s also important to consider your industry when evaluating NPS. Besides, why would a travel booking site compare customer sentiment for their app with a healthcare provider’s member app? It wouldn’t.
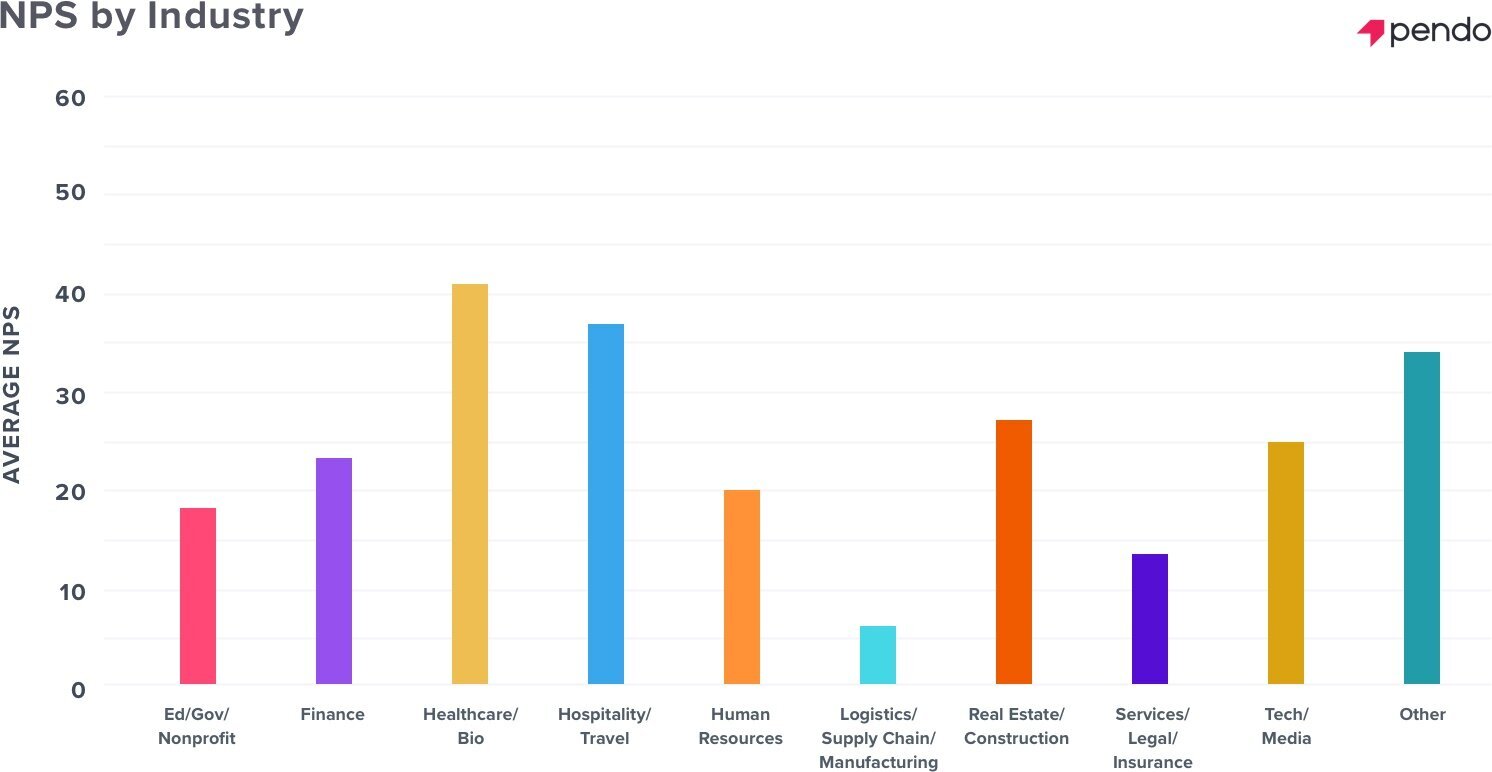
Pendo established product performance benchmarks for four KPIs, including average NPS segmented by vertical. While there are plenty of factors that impact NPS, the benchmarks make it clear that the industry a software company resides in affects how it should evaluate NPS success. Here’s how the different industries stacked up:
The NPS leaders
- Healthcare/bio = 41
- Hospitality/travel = 37
The two industries with the highest average NPS were healthcare/bio and hospitality/travel — two very different domains. Every product manager knows that every user matters, but in these two industries there’s a unique emphasis on the individual and her outcomes.
Think about the last time you communicated with your doctor or waited for health test results. If you used an app or online portal, you probably expected it to provide information quickly and easily, and (more importantly) keep that information secure between you and your doctor. Similarly, if your flight for your once-a-year vacation gets canceled or you have never-ending delays due to bad weather (we’ve all been there), you expect to be able to make changes to your reservation in the airline’s app with only a few taps, and that you’ll receive a notification the second there’s an update about your flight.
Companies in this space are hyper-aware of these types of expectations, and the average NPS scores reflect the work they’re doing to meet them.
The middle of the pack
- Real estate/construction = 27
- Tech/media = 25
- Finance = 24
- Human resources = 20
More industries landed in the middle band of average NPS scores, including real estate/construction, tech/media, finance, and human resources. Although there’s not a clear similarity among all four categories, some initial themes come to mind.
Finance and human resources are both very transactional, and aren’t necessarily what you think of when you think user-friendly or seamless software (no offense, of course). Similarly with real estate/construction, these companies may still be catching up to users’ demands, since the digital transformation didn’t come as naturally for their businesses. Not to mention startups emerge all the time to challenge well-established companies with software products that provide a better customer experience.
Room to grow
- Education/government/nonprofit = 18
- Services/legal/insurance = 14
- Logistics/supply chain/manufacturing = 6
The industries with the most room for improvement were education/government/nonprofit, services/legal/insurance, and logistics/supply chain/manufacturing. Again, there’s no one reason why a particular industry has a higher or lower NPS, but each of these verticals naturally come with their own challenges (structural, financial, etc.) when it comes to delivering effective software — which could be impacting the customer experience.
In the end, a company shouldn’t feel like their NPS potential is limited by the industry they’re in. But, you can get a better sense of your relative performance by thinking about the score within the larger context of your industry.
The most important thing to remember about NPS is that the score is just the first step. Once you’ve calculated it, follow up with users as soon as possible to understand the reasons behind their responses — a single number can only tell so much. With this qualitative feedback, you’re better able to decide what changes could help improve scores, and ultimately create a better product experience.
Ready to see how your product stacks up? Check out the product benchmarks to compare your product’s performance for NPS and four other KPIs.