We’re excited to announce the release of Data Explorer, a powerful tool for creating visualizations and reports from any of your product data—all within a central location in Pendo.
Now, Pendo customers can achieve a more complete understanding of user behavior across the entire product journey using a custom query builder. These resulting custom reports allow users to better analyze any Pendo data involving Page and Guide views, Feature clicks, and Track Events.
You can also filter by user segment, group by metadata, and cluster product data by different time intervals to compare and study how specific groups use your product over time.
Quickly uncover usage trends and patterns with Data Explorer, then utilize these insights to make iterative product improvements and create excellent user experiences.
Query any Pendo data
One of the most exciting aspects of Data Explorer is the ability to pull a combination of Page and Guide views, Feature clicks, and Track Events into a single reporting location, giving you better and more immediate visibility into behavior trends across the entire user journey.
You can also change how the measurement of your data is presented, whether that’s total visitor counts, percentage of accounts, etc., and select specific objects within each data type (e.g., Feature 1, Feature 2, and Feature 3 from the Feature clicks data type).
Want to look at a specific cohort of users? You can add a Segment filter to your query to only view information tied to users in that specific group.
Visualize trends and patterns
After running your query, Data Explorer will create a visualization of the data sources you selected.
Edit the chart types of your data sources, hover over specific areas of the visualization, or even hide certain sources to easily identify patterns, trends, and key insights within the data.
Clicking on a specific point in your visualization will open a list of all Visitors and Accounts that meet those criteria, allowing you to pinpoint which users are taking certain actions throughout your product.
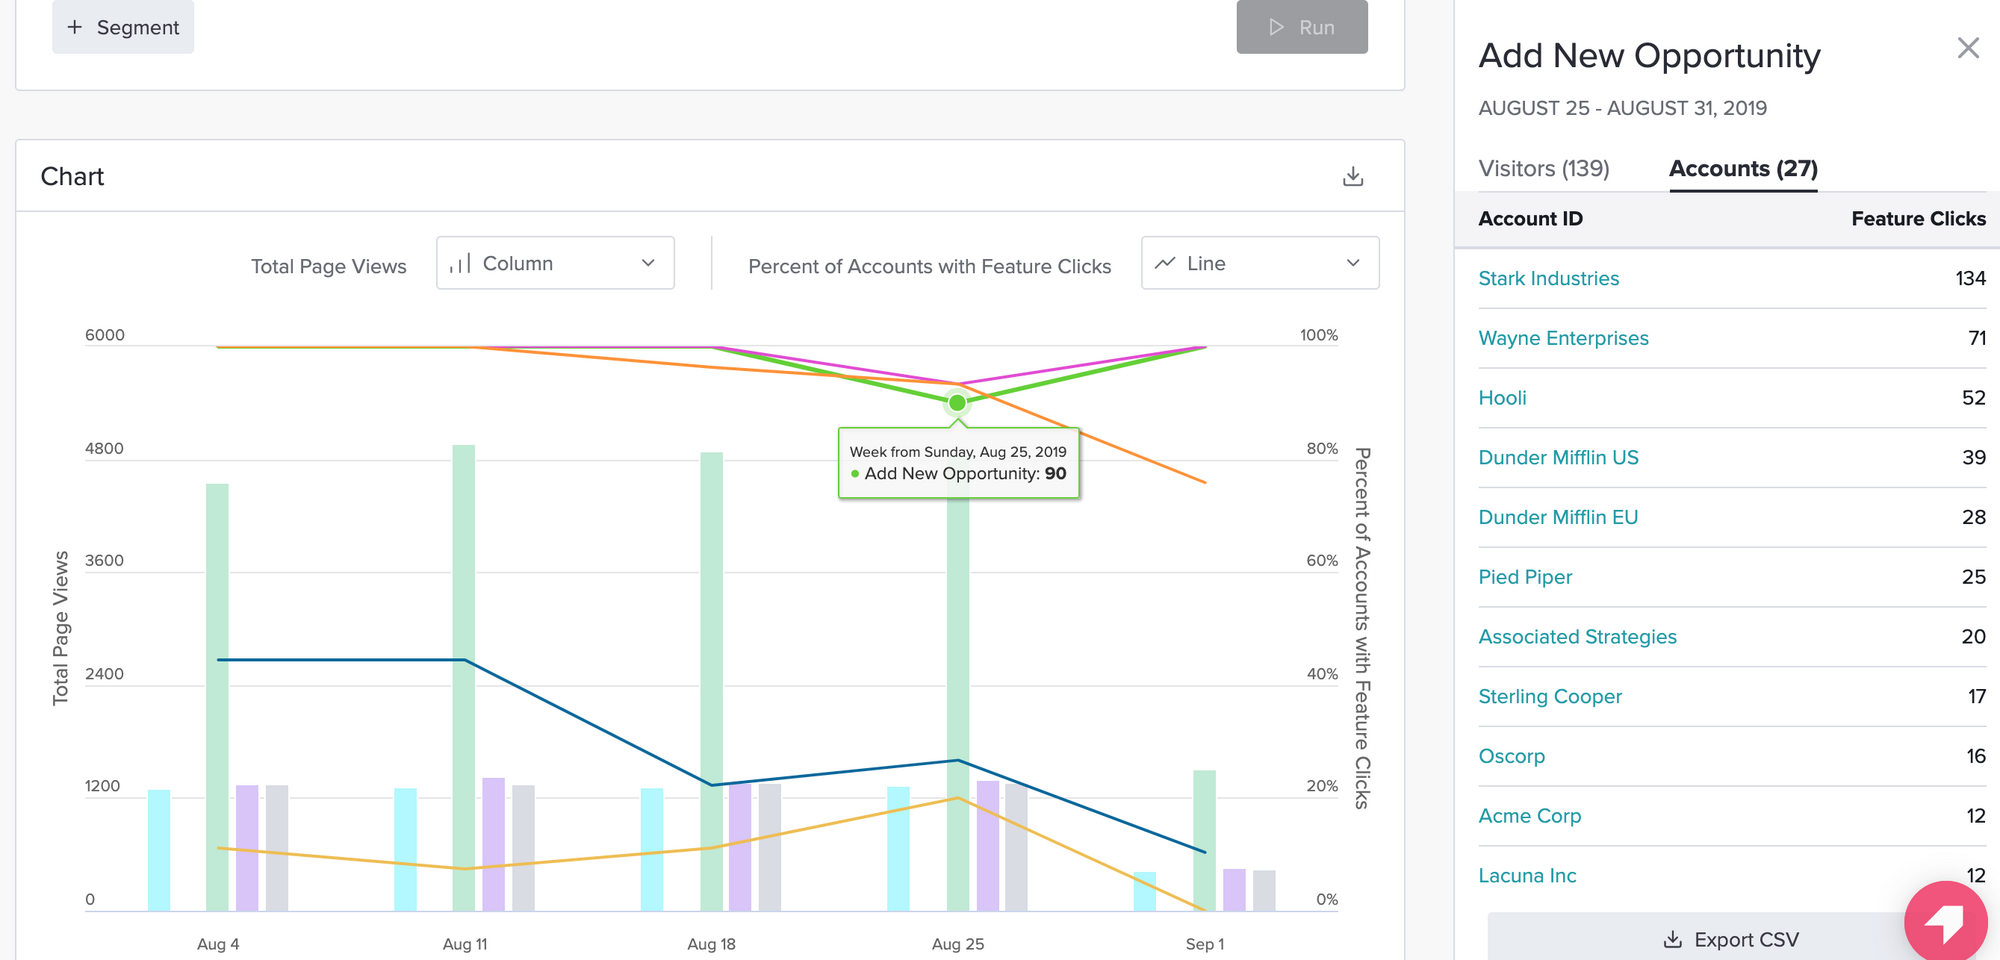
Pro tip: Exporting this data as a CSV and using it as a new Segment opens the door for even more granular and highly targeted Guide publishing.
Save and share your reports
We want to empower every Pendo user to feel confident in asking ad-hoc questions of their data and exploring patterns and trends across their users’ behavior. That’s why you can toggle between each report’s visibility permissions, either giving other Pendo users in your organization viewing capabilities or allowing you to reduce clutter and save the report for your eyes only.
You can also access all Saved Reports in a dedicated section of Pendo, so returning to a query to view new trends or changes is simple.
Want to save your visualization to a Pendo dashboard? You can do that, too! Each visualization can also be exported and downloaded as an image, making it easy to share insights across your team.
Explore, understand, innovate
With Data Explorer, understanding how different customers use and experience your product is easier than ever before. With on-demand reporting and insights, you can quickly identify product areas for improvement, capture the unique behavior of each user segment, and make product-led decisions that ultimately create better experiences for your team and your customers.
![[object Object]](https://cdn.builder.io/api/v1/image/assets%2F6a96e08774184353b3aa88032e406411%2Fa81db2aac96d42948ca1a8b69382bc91?format=webp)
![[object Object]](https://cdn.builder.io/api/v1/image/assets%2F6a96e08774184353b3aa88032e406411%2F2f1fa13848a54351a70d3d6ff5b4ad75?format=webp)
![[object Object]](https://cdn.builder.io/api/v1/image/assets%2F660d4d0913e147ef991a54db871be261%2F9adf75a4b98946f799e5a904e0e37e5e?format=webp)
