This is the fourth in a series of posts on the impact of the COVID-19 crisis on software product usage across 40+ industries and sub-industries, based on an analysis of anonymized product usage data across Pendo customers. Pendo updates the data weekly, with fresh analysis on emerging trends.
I’d like to thank Alex Rosenbower on our data science team for partnering on this analysis and building these visualizations.
One of the more eye-popping jumps in product usage we’ve seen over the last six weeks of tracking happened the week of April 13, when stimulus checks and Paycheck Protection Program loans began to hit the bank accounts of millions of Americans.
Banking applications saw a 41 percent spike in usage that week, and they remain among just 4% of Pendo customers that have experienced accelerating product usage throughout the global pandemic. Banking product usage remains up 8% since March 1, even as stay-at-home orders have begun to lift.
The big question facing banks is whether the shift to digital banking will last—alongside our data, early reports from the likes of Fidelity, Key Bank and Bank of America indicate yes, and they’re making investments in their digital experiences to sustain the shift.
Check out more analysis of product usage trends in financial services below, as well as an updated view of usage trends across 14 key industries in our analysis.
Impact of COVID-19 on finance product usage growth
The week much of the U.S. started staying home, 43% of financial software platforms experienced drastic declines in usage. Those drops seemed to reflect temporary adjustments to behavior, with 89% of products now showing limited impact and 7% of platforms continuing to accelerate. (See definitions of these categories here.)
Average weekly product usage change across finance sub industries
Other sectors of financial services haven’t experienced quite the spike in usage as banking. FinTech platforms have remained steady, while payments and insurance have seen usage slow or decline since our base line of March 1.
Impact of COVID-19 crisis on product usage growth
Overall software product usage continues to normalize, with 91% of software products seeing usage return to normal levels. Just 1% of products are still declining, while a steady 4% continue to accelerate over the last several weeks. (See definitions of these categories here.)
Average weekly product usage change
In the charts below, we’ve provided a visualization of software usage across 14 key industries—grouped by positive and negative trend lines. While education software has begun to dip as summer breaks begin, the category continues to see strong usage since the pandemic began. And real estate has creeped onto our positive trending chart, with a 4% increase in usage since March 1.
Over on the negative trending chart, hospitality and health care product usage has climbed slowly over the last several weeks. Though still well below pre-COVID levels, both trend lines reflect the slow reopenings of restaurants and doctors’ offices, and early signs of life for the travel industry.
Other sectors of financial services haven’t experienced quite the spike in usage as banking. FinTech platforms have remained steady, besides that April 13 peak, while insurance platforms have seen usage slow or decline since our base line of March 1.
Payments software usage has also slowed as retail stores and restaurants closed or adjusted their business models, but this is a sub sector to watch as the economy improves. Digital payment platforms will become even more relevant as we move increasingly to touchless transactions.
Methodology
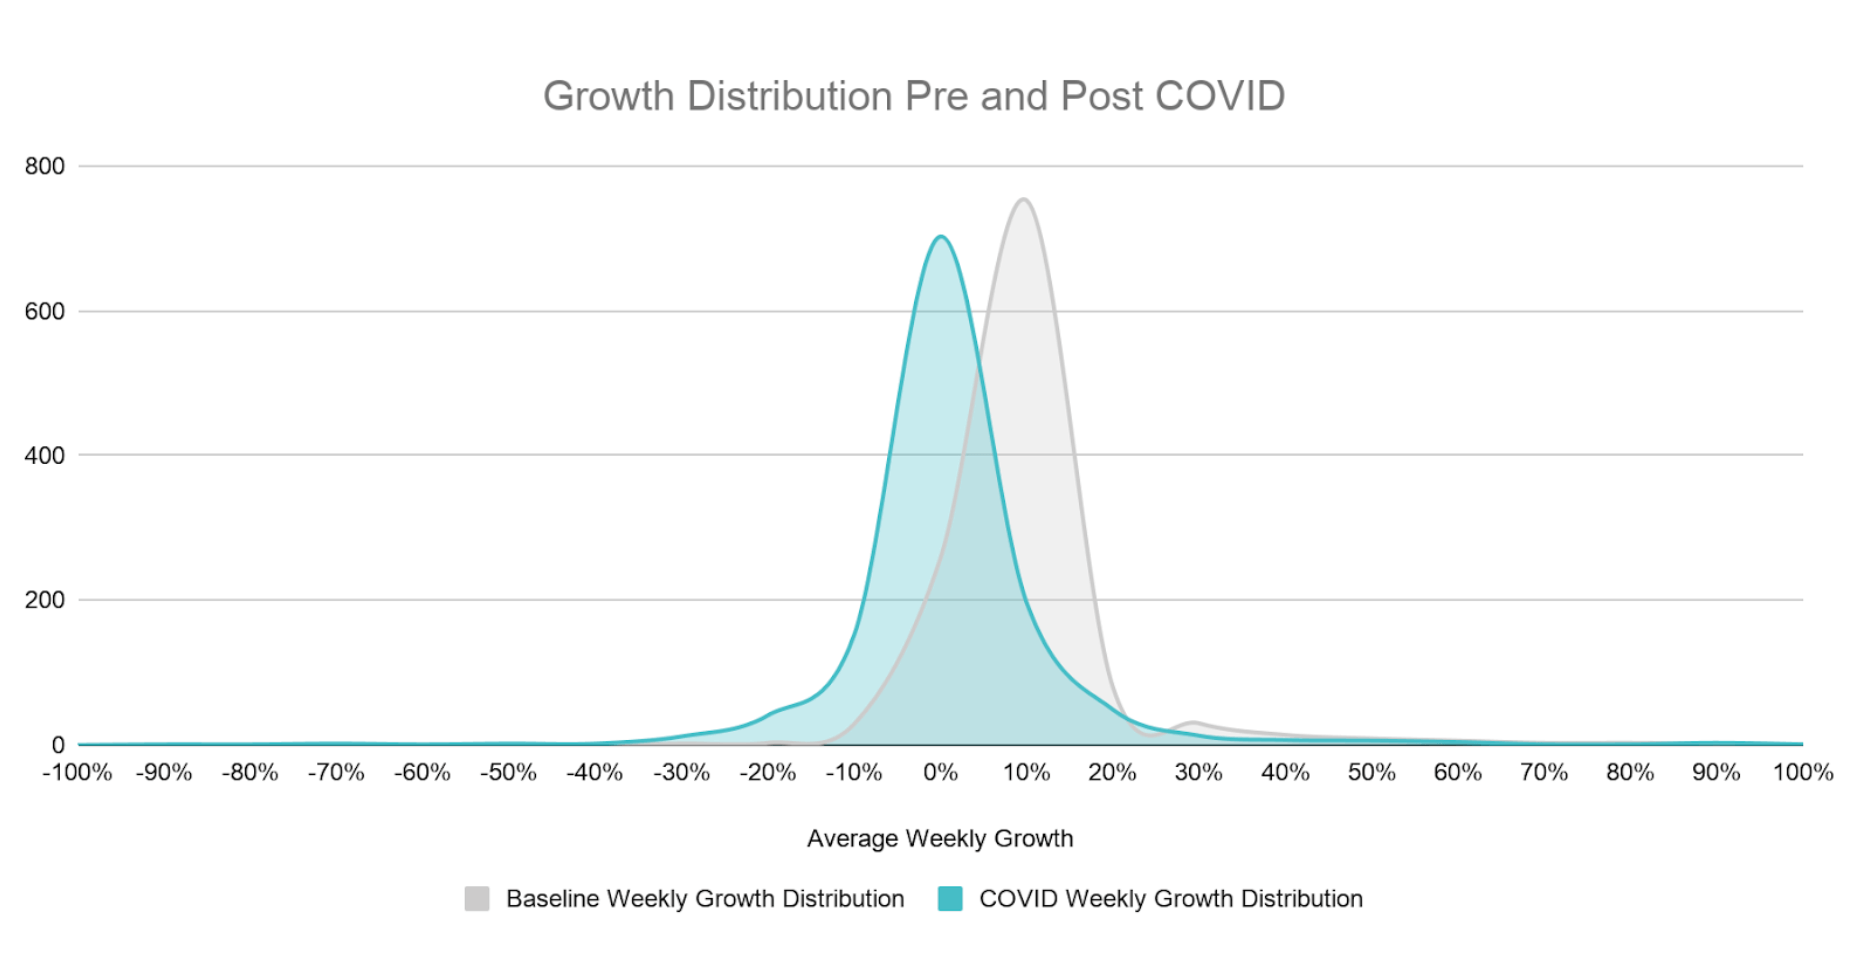
We gathered anonymized product usage data from a subset of Pendo customers and analyzed their average weekly growth during business days in the five weeks prior to the “COVID period” (2/3/20 – 3/6/20) to establish a baseline distribution of growth. We then updated average weekly growth during the COVID-19 period plotted against the baseline period. Products included in the analysis fall in one of the 40 industries, have at least 90 days of usage data and more than 10,000 average weekly events leading up to the COVID period to eliminate any outliers.
Growth category descriptions
The baseline average weekly growth of the customers fitting the criteria above is unweighted and represented in the gray distribution in the chart below. The standard deviation of growth during the baseline period was 12%. The distribution of growth during the COVID period is represented in the blue distribution and plotted along side the baseline period. The COVID period distribution is shifted to the left indicating slower growth during this period, overall.
Using the baseline distribution of growth, we established the following categories for how product usage has been impacted during the COVID period.
| Category | Description | Significance |
|---|---|---|
| Accelerating | Average growth during the COVID Period accelerating more than 15% | > 1.5 std dev above |
| Limited Impact | Average growth during the COVID Period was between -6% and 15% | +/- 1 std dev |
| Slowing | Average growth during the COVID Period decelerated between -7% and -12% | between 1 and 1.5 std dev below |
| Declining | Average growth during the COVID Period decelerated below -12% | > 1.5 std dev below |