Updated January 2026
You've just installed Pendo. Your dashboard is loading, data is starting to flow in, and now you're asking: "What do I do first?"
This is the moment most new Pendo users face analysis paralysis. Should you start tagging pages? Build dashboards? Define metrics? The answer: You need a systematic framework.
The Product Analytics Hierarchy of Needs is Pendo's official methodology taught in our [Product Analytics Certification] for moving from raw data to actionable insights. This 5-step framework guides you through exactly what to do after installation—starting with data validation and ending with organization-wide analytics maturity.
Whether you're brand new to product analytics or just new to Pendo, this guide will help you avoid common mistakes and accelerate your time to value. Best of all: no engineering required.
On a broader level, the craft of product management has quickly and dramatically swung from gut-feel decision making to data-informed decision making. Why? When you have great data, you make better decisions—ones that increase retention, adoption, and revenue. And if you’re a Pendo customer, our product analytics tool allows you to access that data. We’re proud of what we’ve built and love when our customers use our tools to transform their products. But even with the right tools, it can be hard to know where to start. Many of our customers struggle with what to do once they’ve installed Pendo and have lots of new data at their fingertips.
When it comes to becoming more data-driven, data and tools alone won’t help you reach your goals. You need to create change inside your organization, build a system that brings data into the decision making process, and align on the metrics that your business cares about. Doing this takes work, but we’ve found that utilizing a framework can help you set the right foundation and then build on that foundation to mature your organization’s use of data.
Today, we’re excited to share the Product Analytics Hierarchy of Needs: a new Pendo framework that will help you leverage our tools to reach your data goals. It’s possible to use the framework with other tools (or with no tools), but it’s been tailored specifically for folks with Pendo. Let’s dive in.
Before you begin: Understanding Pendo's data model
Before diving into the hierarchy, let's clarify how Pendo captures data. This foundation will help you understand what happens at each step.
What Pendo tracks automatically
As soon as you install Pendo, it begins capturing data retroactively—meaning you don't need to configure anything upfront. According to [Pendo's documentation](https://support.pendo.io/hc/en-us/articles/360061487572), "data collection begins immediately after installing the Pendo SDK."
Pendo automatically collects:
- Page views: Every screen or page your users visit
- Feature clicks: Interactions with buttons, links, and UI elements
- Session data: Time spent in your app, session duration
- User flows: The sequence of pages users navigate
This is called "retroactive analytics"—you can tag a feature today and see usage data back to your installation date.
Two types of data in Pendo
Pendo organizes data into two categories:
#1 Metadata (who your users are)
- Visitor metadata: User ID, email, role, custom properties
- Account metadata: Company name, plan type, industry
#2 Event data (what your users do)
- Page load events
- Feature click events
- Track Events (custom events configured by developers)
- Guide interaction events
This distinction matters: metadata lets you segment users, while event data shows you behavior patterns.
No-code analytics: What this means for you
Unlike tools that require developers to instrument every event, Pendo's low-code approach means you can start analyzing behavior immediately.
You don't need to:
- Write code to track clicks
- Wait for engineering sprints
- Manually instrument every interaction
The hierarchy framework builds on this foundation. Now let's walk through each step.
How to use the product analytics hierarchy framework
This step-by-step framework will help you get the right data, use it, and bring real change to your company’s decision making process. It works like Maslow’s popular hierarchy of needs—you must fulfill the first step before you can move up to the next, and so on.
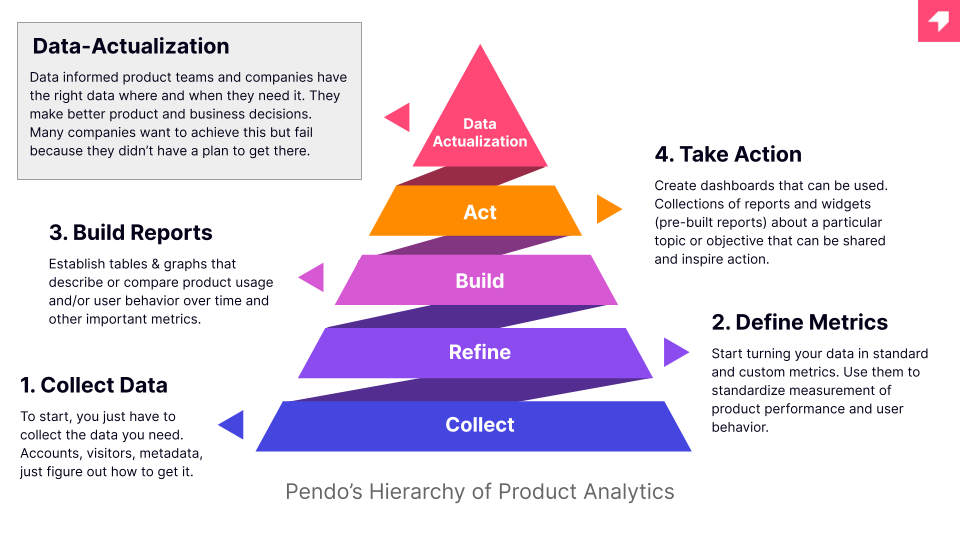
As you can see, the framework also speaks to how Pendo’s products map to each step. So as you get started, be sure to jump into Pendo and get to work. Now, let’s take a look at each step starting from the bottom and work our way up.
Step 1: Collect data
The first step towards becoming data-informed is to collect the data you’ll need. This includes information about the people who use your product and information about their behavior (events, page loads, clicks, etc.). Manipulating metrics based on this data is how you’ll be able to answer almost any product management question (more on that in step two).
Here are some examples of people and behavior data you might collect.
People data:
- Visitors
- Accounts
- Segments
- User metadata
You’ll need to know if you have this data already and if so, where it lives (it often lives in your CRM).
In-app behavior data:
- Page load
- Feature usage
- Track events
- Clicks
- In-app guide interaction
Getting this data can be difficult. You’ll either need to ask engineering to help pull this data, or you can invest in a product analytics tool like Pendo that will give you access to it on-demand.
The biggest challenge in this first step is finding data, making sure you can access it, and then getting it into a place or tool where you can analyze it. Try to eliminate gatekeepers (like engineering) so you can do more yourself at this phase. Pendo was built to make this data collection process generally non-technical and easy. If you’re not a Pendo customer, you can use our free product to start collecting product data.
Step 2: Refine data into metrics
Once you have the raw ingredients flowing in, you need to turn this data into more meaningful metrics.
Metrics group and organize data to help you measure specific aspects of your product or business. Before you can define the key metrics you want to track, start by understanding your product’s goals and objectives. For example, if your product is a CRM tool, you might care about the number of contacts a user adds to their CRM. How would you define a metric to track this?
At first it’s going to be hard to define the metrics you want to measure for your product. Defining metrics requires individuals and teams to align their priorities for a given product, which is challenging—but a great challenge for a motivated PM.
Work with key stakeholders (e.g. product, engineering, product ops) to define the goals and objectives of your product, being as specific as possible. Use that data to back your way into metrics you’ll need in order to measure the progress towards your goals. And remember to choose metrics that are easy and accurate to track.
Step 3: Build metrics into reports
Metrics help you understand the performance of your product and identify trends and patterns to inform decision making. But it’s hard to do this if you’re not tracking these metrics over time and consistently analyzing them. Reporting is the process of doing just that.
Reporting is the act of establishing tables and graphs that describe or compare product usage over time. This allows you to see how metrics are changing, which can help you identify trends and patterns that may not be immediately apparent. For example, a report showing the number of active users in your product over time can help you see if the number is increasing or decreasing, and identify any factors that may be influencing this trend.
In Pendo, there are a few pre-built reports that are particularly helpful in this step.
- Paths and Funnels: Paths help you discover what users are doing before or after using a specific Page, Feature, or Track Event. A Funnel allows you to track how users move through a defined set of steps of Pages or Features that you want users to follow.
- Retention reporting: Retention helps you analyze how your product has grown over time and what is making your customers come back to your platform. It’s used to answer questions like, “Are people using my product over time?” and “Are users coming back?”
- Data Explorer: As you get more advanced you’ll want the ability to combine metrics, slice data and metadata, and build custom reporting quickly. You can do all of this (and more) in Data Explorer.
Example: How to build your first feature adoption report
Let's make this concrete. Imagine you've just launched a new export feature. Here's how to track adoption using the reports above:
Building the report (15 minutes):
1. Create a Funnel showing: Home page view → Feature page view → Export button click → Successful export
- This shows your conversion rate at each step
- You'll immediately see where users drop off
2. Add a Segment comparing: Free users vs. Paid users
- Do paid customers adopt faster?
- Should you gate the feature differently?
3. Build a Path starting from the Export feature
- What do users do AFTER exporting?
- Do they return to a specific workflow?
4. Track Retention for export users vs. non-users
- Do users who export stick around longer?
- This tells you if the feature drives value
5. Create a Dashboard combining all four reports
- Title it "Export Feature Adoption"
- Share it with your product team
- Review weekly to track trends
What you'll learn:
- Adoption rate: What % of users discover and use the feature?
- User segments: Which customers find it valuable?
- Drop-off points: Is discovery the problem, or activation?
- Retention impact: Does this feature improve stickiness?
This same framework works for any feature, workflow, or user journey. Start with one funnel, layer in segmentation, and expand from there.
Step 4: Take action
You’ve done a lot of work up to this point, and now it’s time for that work to pay off: to turn your product analytics reporting into insights, and then into action.
What does this look like in practice? Let’s say you’ve been tracking retention and usage of key features. After reviewing the data you learn that everyone who uses your reporting feature retains at a much higher level. You’ve just unlocked an insight! You can now use this insight and the supporting data to ask your engineering team to prioritize work on this feature, because it should improve retention.
And this is just the tip of the iceberg. To really unlock positive action, you’ll want to leverage more advanced data tools. Here are some examples to keep in mind:
- Analysis: Review the data you have. Ask questions about the results, build hypotheses, and then try to find answers. Connect the dots across different types of data and try to determine what’s preventing your product from achieving its goals.
- Dashboards: A dashboard is a collection of reports and widgets (i.e. pre-built reports) about a particular topic or objective that help fuel collaboration and inspire action. For example, you can use a dashboard to track and measure adoption of a new feature, self-service upgrades, or new product discovery.
- Storytelling: Most data and insights benefit from a story. Many product teams deliver their insights in a slide deck, with contextual information, logic, users quotes, or other supplemental data. It’s a great way to bring your data to life and better influence key stakeholders.
Getting to this point in the framework takes time, and even with all the right data, metrics, reports, and insights, you’ll still always have to work on the process. It’ll never be easy for product teams to make the right decisions and get the buy-in to support them—but being data-informed will help. And over time you’ll start to see your entire company evolve, which brings us to the final stage: Data Actualization.
The final step: Data Actualization
Less of a destination and more of state of being, the final stage of the hierarchy is Data Actualization. At this point, your whole company has a common language of metrics and reports. Product data is used to help make business decisions—not just product ones. It’s also present at board presentations along with revenue data. The old tools of gut-feel and intuition are only used as a starting point or as an aid in tricky situations. You’re able to ask and answer progressively harder questions because you have the right data and tools to be able to answer them.
Being a data-driven product organization is in reach, but it’ll take more than just tools. We hope this framework will serve as a helpful roadmap, but it’ll take time and you may find yourself moving between stages more than once. Remember to ground yourself in what you’re trying to achieve with your product—which is ultimately a better experience for your users.
Ready to put the Product Analytics Hierarchy of Needs into practice? Sign up for a Pendo Free account to start collecting, analyzing, and taking action on product data.
![[object Object]](https://cdn.builder.io/api/v1/image/assets%2F6a96e08774184353b3aa88032e406411%2F846715ac5c26410bbb6ffd8f6caa4e70?format=webp)
![[object Object]](https://cdn.builder.io/api/v1/image/assets%2F6a96e08774184353b3aa88032e406411%2Fa62864d2453e4b12aee3eca57c793788?format=webp)
![[object Object]](https://cdn.builder.io/api/v1/image/assets%2F6a96e08774184353b3aa88032e406411%2Fd770afd0ea5f4436a208166ea13b742d?format=webp)
