Editor’s note: In January 2022, we updated the calculations for two of the Product Engagement Score (PES) components to make the metric more stable and actionable. Learn more about the changes to PES here.
When we first introduced the concept of an engagement score, we built off our product benchmarks study, which used our best available metrics for feature adoption, stickiness, and retention. The goal was to give product leaders a single metric to describe how their product is performing and, more specifically, one that’s easy to generate, understand, and improve upon. Just as NPS measures how users feel, PES measures how users engage–and combining these two metrics is extremely powerful.
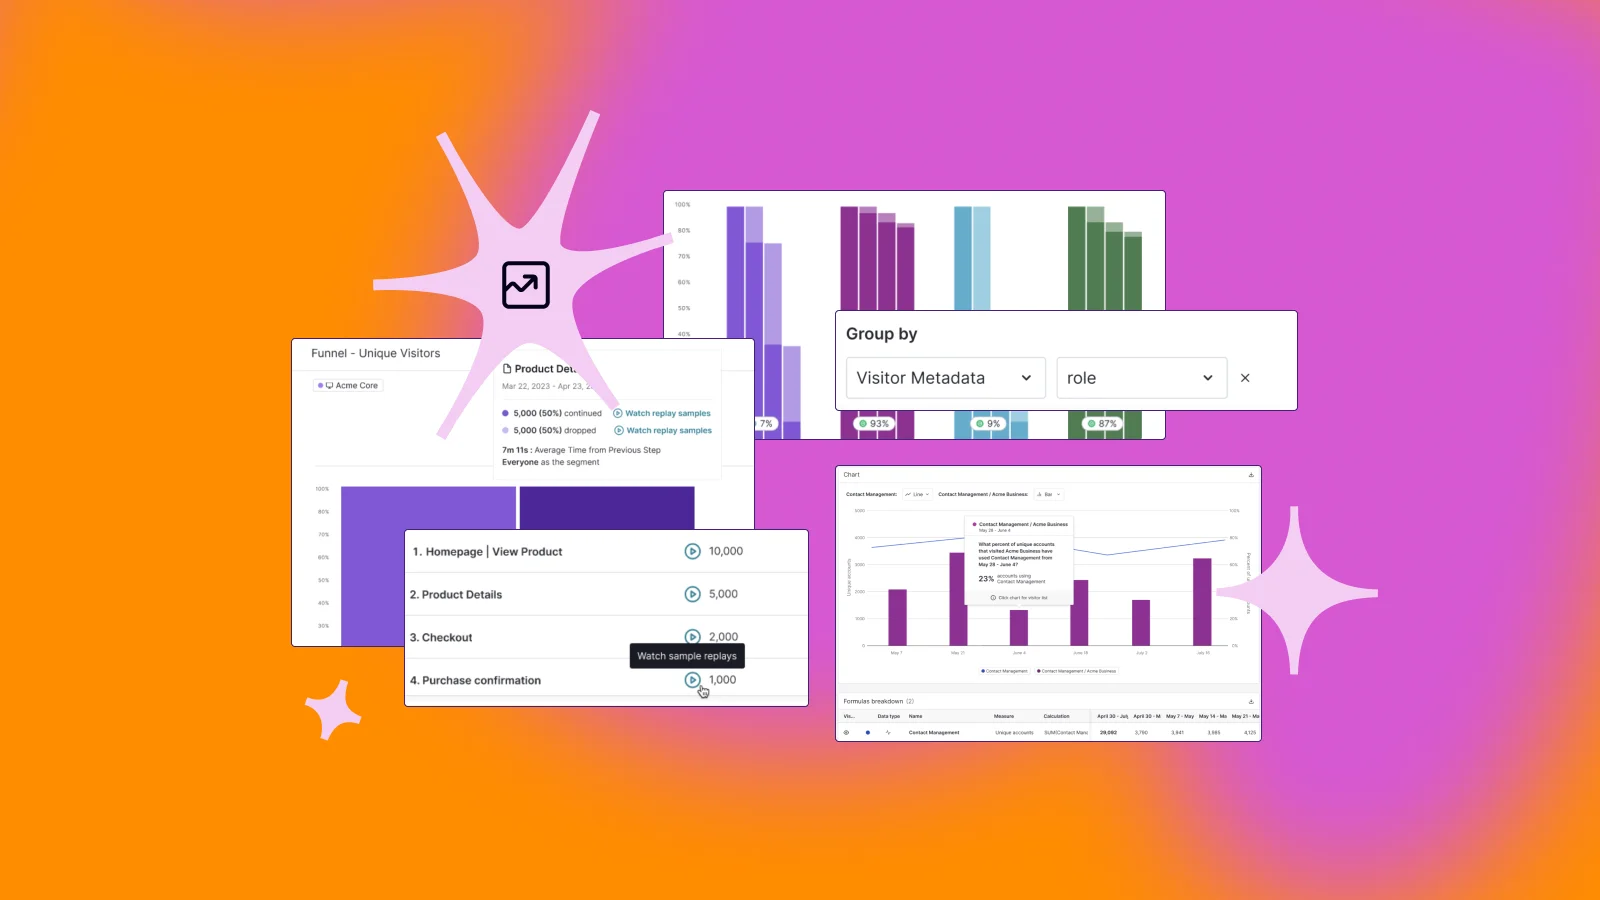
Early adopters of the product engagement score (PES) will notice that we’ve updated the components that determine your PES. These changes are the result of hours of conversations with product leaders, and are rooted firmly in customer feedback, additional research, and enhancements to Pendo’s analytics capabilities. We are confident that this evolved definition will be a more valid and useful metric for tracking product engagement.
Here’s what’s been updated in PES, and what remains the same.
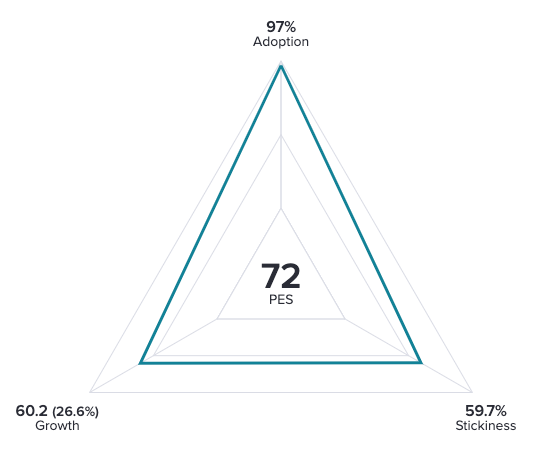
Adoption
Adoption is now based on usage of your product’s most important features, which customers will designate using Core Events. Previously, adoption was defined as the percentage of features that generate 80% of click volume. However, over time we realized that this was only measuring how usage is concentrated within your product, and not if that usage is meaningful. By measuring adoption of Core Events, we focus on the parts of a product that drive value, which is a better predictor of overall engagement and long-term user retention.
Stickiness
Stickiness remains the same: the 30 day rolling average of the percentage of monthly active users who return on a more frequent basis (either daily or weekly). This industry standard metric is broadly applicable to many different types of products and user segments, and is a strong indicator that a product has traction.
Growth
Growth is a new addition to the PES calculation, but it’s a key factor in a company’s long-term success. Growth is the net effect of your user acquisition and user retention efforts. Is your product able to acquire and retain new users faster than your existing users abandon it? Whether it’s by adding new accounts or increasing usage within existing accounts, growth is a common top-line metric for modern product teams, and a key indicator of product engagement.
For the product engagement score, we determine your growth value by taking your growth rate over a given period and compounding it to generate a projected annual growth rate. Growth rates continue to increase exponentially–like interest in a bank account–which results in large changes annually. For example, if your user base grows 2.6% every month, at the end of the year you’ll have grown your users by 36%, giving you a growth value of 36. This can be expressed mathematically as: (1.026) ^ 12 = 1.361
Once you have your values for adoption, stickiness, and growth, PES is calculated by taking the average of those three numbers.
Getting started with PES
To get started with PES, add the Product Engagement widget to your main Pendo dashboard and begin discussing with your team how each component contributes to your overall score. Then, of course, think through possible strategies for improvement. For example:
-
- If you’re seeing low adoption, revisit your onboarding process to drive better awareness of your Core Events
- To improve stickiness, investigate the behaviors of your highest-frequency users to see if certain outcomes or workflows are responsible for driving that level of interaction
- If growth is your lowest metric, re-examine your user acquisition and retention strategies so your net user base grows more efficiently
You can also use PES to compare engagement between different user segments, and benchmark engagement among products within your larger portfolio.
While we are proud of this current articulation of the product engagement score, we do plan to continue evolving it based on customer feedback and market need, and as our ability to measure and define engagement improves. As always, your feedback is a gift, so don’t hesitate to share yours with us via your Pendo Feedback portal.
For more information on PES, visit our help documentation or reach out to support@pendo.io with any questions.