This is part of a series of posts on the impact of the COVID-19 crisis on software product usage across 40+ industries and sub-industries, based on an analysis of anonymized product usage data across Pendo customers. Pendo updates the data weekly, with fresh analysis on emerging trends.
I’d like to thank Alex Rosenbower on our data science team for partnering on this analysis and building these visualizations.
The COVID-19 crisis has stressed our health care system in ways no one could have anticipated. With doctors and dentists’ offices closed or operating on a limited base and hospitals void of elective procedures, most health care software platforms experienced drastic decreases in product usage. The exception to that is telemedicine, a lifeline for both doctors and patients during this time.
Most projections show telemedicine continuing to grow in popularity even as people return to physical appointments—government incentives for physicians who provide telehealth services are likely to continue and 76% of people who used telehealth during the crisis have said they’d use it again. Our data shows no signs of a slowdown, with usage up 125% above our March 1 base line, its largest spike to date.
Impact of COVID-19 on telehealth product usage growth
Healthcare software took a hit during the crisis, with overall usage dropping as much as 39% in mid-April. Use of electronic health records platforms dropped by half for several weeks before slowly climbing up over the last two months as people reschedule cancelled appointments and return to receiving care in-person. Usage of these platforms is still down 24%.
While hospital platforms saw a bit of a usage dip as elective procedures were put on pause, they were less impacted overall. And in fact, usage climbed above the March 1 baseline for the first time last week. Biotechnology platforms have also rebounded. Research and clinical trials put on hold during the health crisis are back on, and perhaps making up for lost time. Usage is up 11% over the March 1 base line.
Average weekly product usage change
In the charts below, we’ve provided a visualization of software usage across 14 key industries—grouped by positive and negative trend lines.
Methodology
We gathered anonymized product usage data from a subset of Pendo customers and analyzed their average weekly growth during business days in the five weeks prior to the “COVID period” (2/3/20 – 3/6/20) to establish a baseline distribution of growth. We then updated average weekly growth during the COVID-19 period plotted against the baseline period. Products included in the analysis fall in one of the 40 industries, have at least 90 days of usage data and more than 10,000 average weekly events leading up to the COVID period to eliminate any outliers.
Growth category descriptions
The baseline average weekly growth of the customers fitting the criteria above is unweighted and represented in the gray distribution in the chart below. The standard deviation of growth during the baseline period was 12%. The distribution of growth during the COVID period is represented in the blue distribution and plotted along side the baseline period. The COVID period distribution is shifted to the left indicating slower growth during this period, overall.
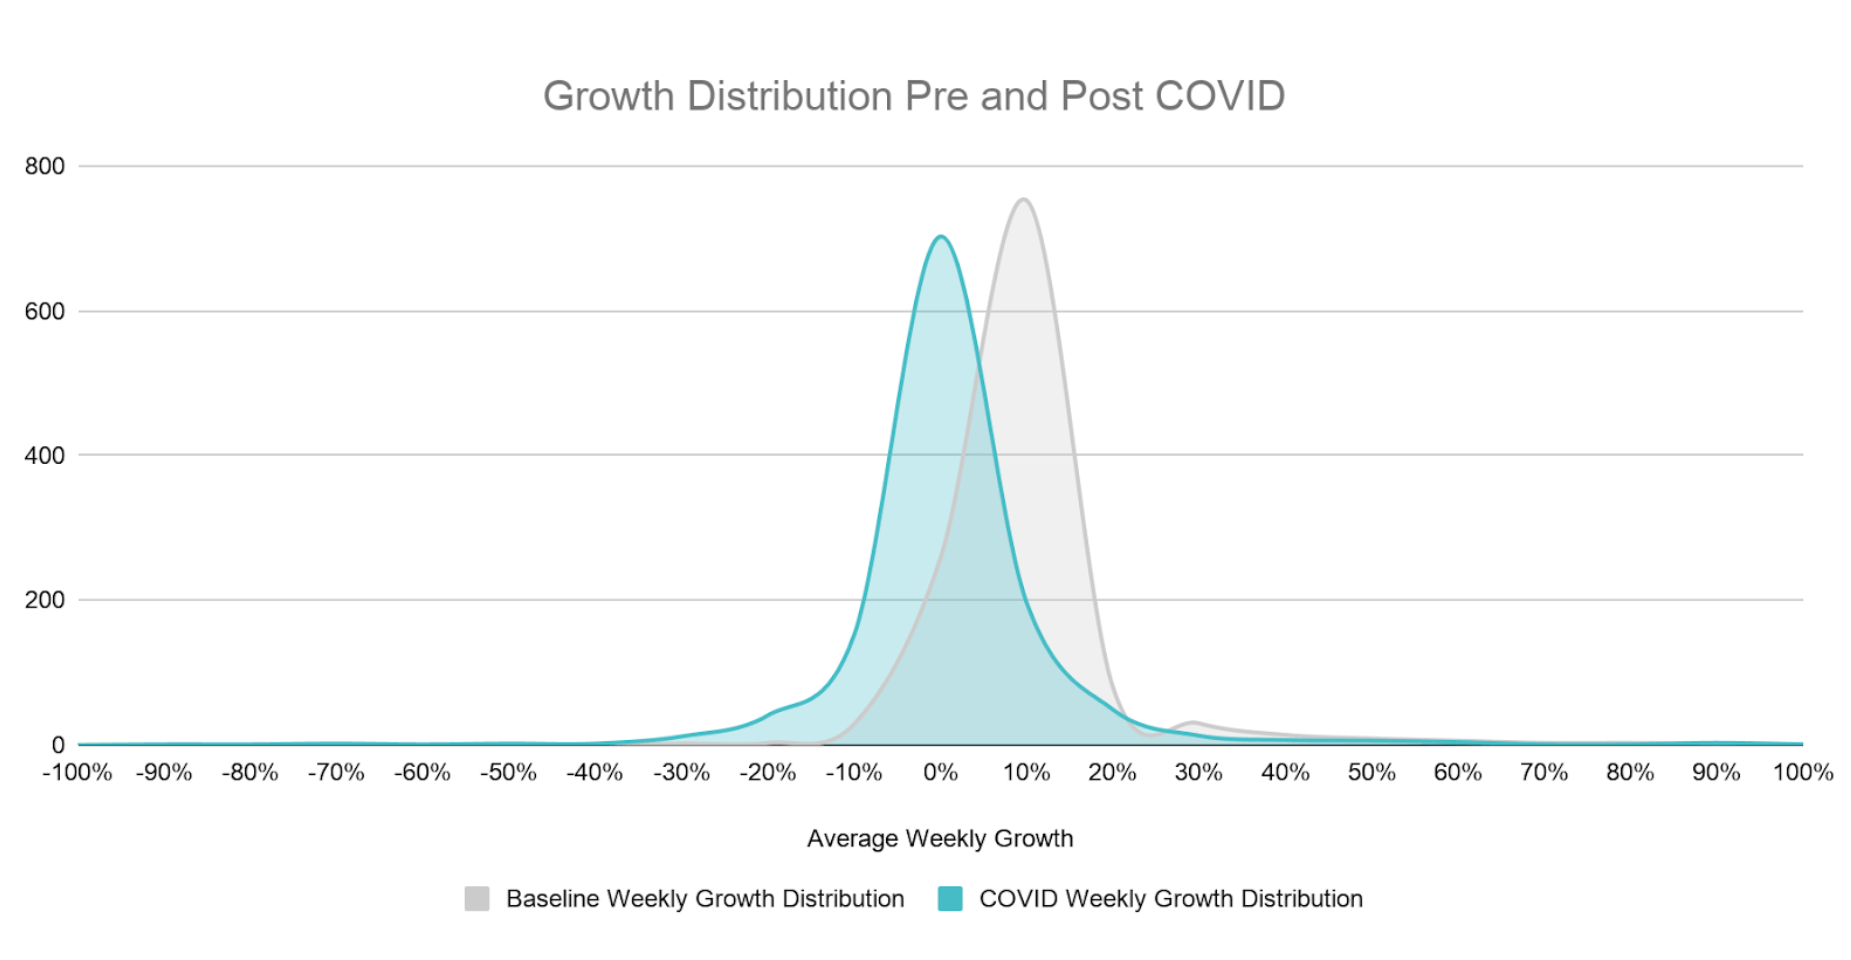
Using the baseline distribution of growth, we established the following categories for how product usage has been impacted during the COVID period.
| Category | Description | Significance |
|---|---|---|
| Accelerating | Average growth during the COVID Period accelerating more than 15% | > 1.5 std dev above |
| Limited Impact | Average growth during the COVID Period was between -6% and 15% | +/- 1 std dev |
| Slowing | Average growth during the COVID Period decelerated between -7% and -12% | between 1 and 1.5 std dev below |
| Declining | Average growth during the COVID Period decelerated below -12% | > 1.5 std dev below |

![[object Object]](https://cdn.builder.io/api/v1/image/assets%2F6a96e08774184353b3aa88032e406411%2F498359a05c4541fb85ae5df114860a55?format=webp)
![[object Object]](https://cdn.builder.io/api/v1/image/assets%2F6a96e08774184353b3aa88032e406411%2F6caec04e297c4793a168f14b0928811e?format=webp)
![[object Object]](https://cdn.builder.io/api/v1/image/assets%2F6a96e08774184353b3aa88032e406411%2F0b757f07c669428ca98343d5a421e209?format=webp)
