
Table of Contents
In a rush?
Download the PDF for later
Introduction: Laying the foundation for data-driven product management
If you ask five product managers (PMs) to name the most important product metrics to track, you’re likely (read: definitely) going to end up with five completely different answers—and grounds for some healthy debate. This is because when it comes to data, today’s product leaders find themselves in a paradox of choice. There are so many product metrics you could be tracking, but it’s not always clear which ones you should be tracking.
Gone are the days of a lack of access to meaningful product data. Instead, product practitioners of all levels are tasked with honing in on the metrics that will be most impactful—those that will help them understand how users navigate their product, how product usage correlates with positive outcomes, and how their product impacts the business’ bottom line.
With effective measurement in place, product leaders can base decisions on data, and build products that both meet (and exceed) users’ needs and propel the business forward. Product-led companies go so far as to rally the entire organization around product data as a central resource and shared language. So, they better make sure they’re measuring the right things.
The right KPIs for any one company to track will ultimately depend on its product, growth stage, and overall goals, but we believe there are ten that every product leader should have on their radar. Whether you’re a PM who’s deeply involved in the day-to-day or a product executive who cares more about the big picture, the metrics in this guide will provide a foundation for your product analytics strategy.
Business outcomes: Your product impacts key business and financial outcomes both in the short and long term. Most notably, your product experience directly affects retention and churn, which in turn impacts revenue numbers.
Product usage: As the name suggests, these KPIs reflect how users behave inside your product. Which features do they use the most? Where are they getting stuck? How many users continue accessing the product over time? While product usage data is beneficial on its own, it’s even more powerful when combined with qualitative metrics like customer sentiment and feedback.
Product quality: These KPIs measure how well your product is doing what it is supposed to do. What is your product response time? How much downtime did you experience last month? For quality metrics, it’s often best to set an internal benchmark and measure yourself against it monthly or quarterly.
1. Net revenue retention (NRR)
How much revenue are we retaining from existing customers?
Business outcomes
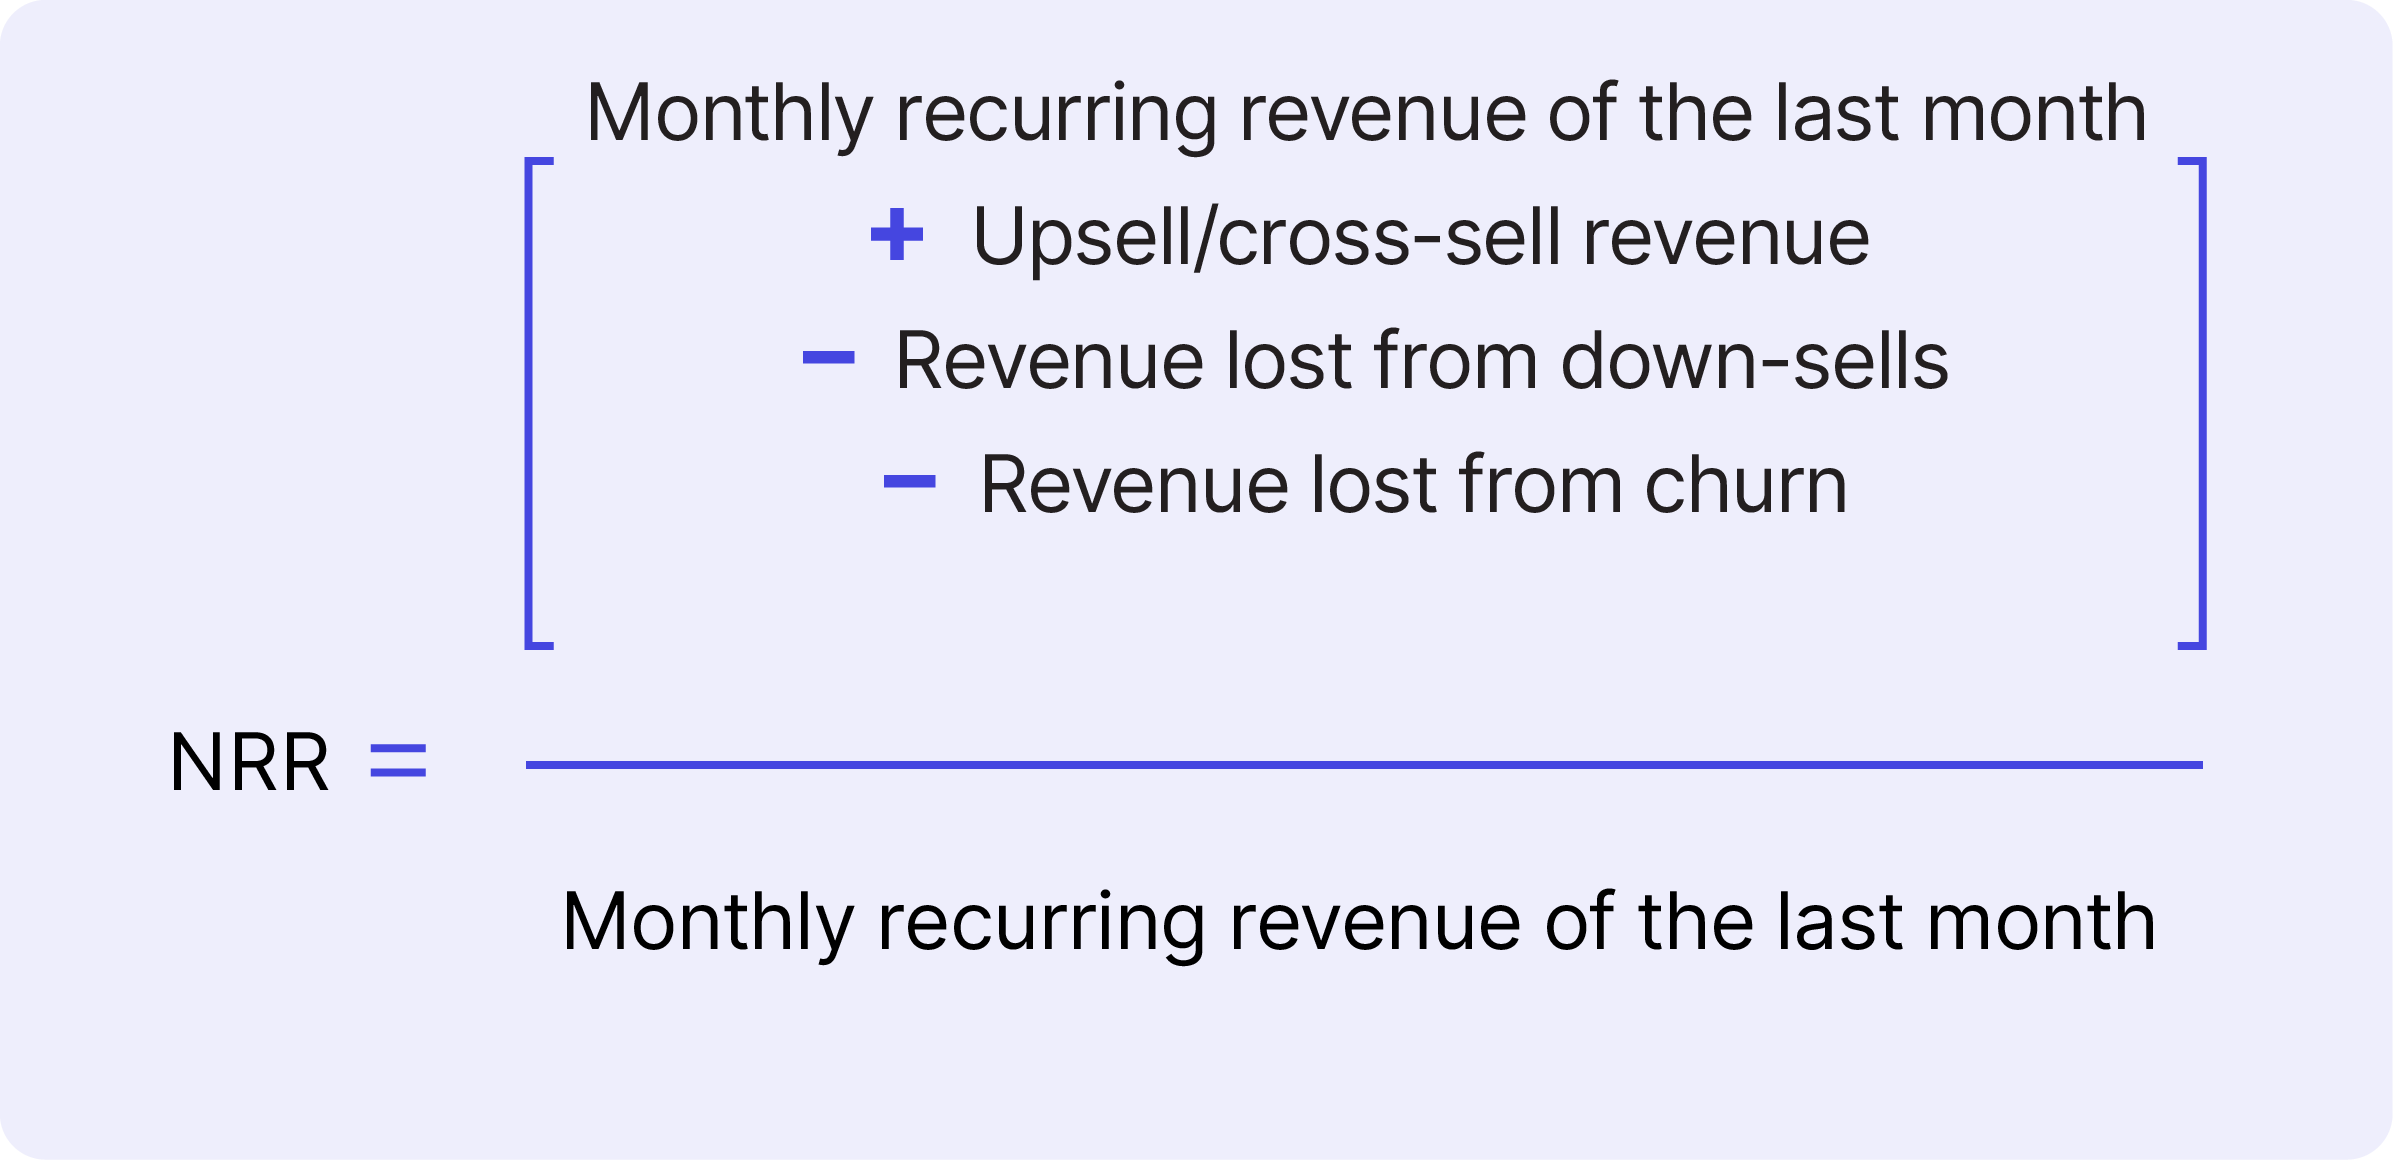
Net revenue retention (NRR) is the percentage of revenue retained from your existing customers over a given period of time. Put simply, it’s the difference between expansion and churn. NRR is generally expected to be a value above 100 percent, with the assumption that you’re going to lose some customers, but you’re also going to find ways to expand the value of the customers that you keep.
How to measure NRR
As the definition suggests, you can measure NRR by subtracting churn from expansion, which requires four values:
- Monthly recurring revenue of the last month
- Revenue generated through upsells and cross-sells
- Revenue lost due to down-sells
- Revenue lost due to churn
From there, the calculation looks like:
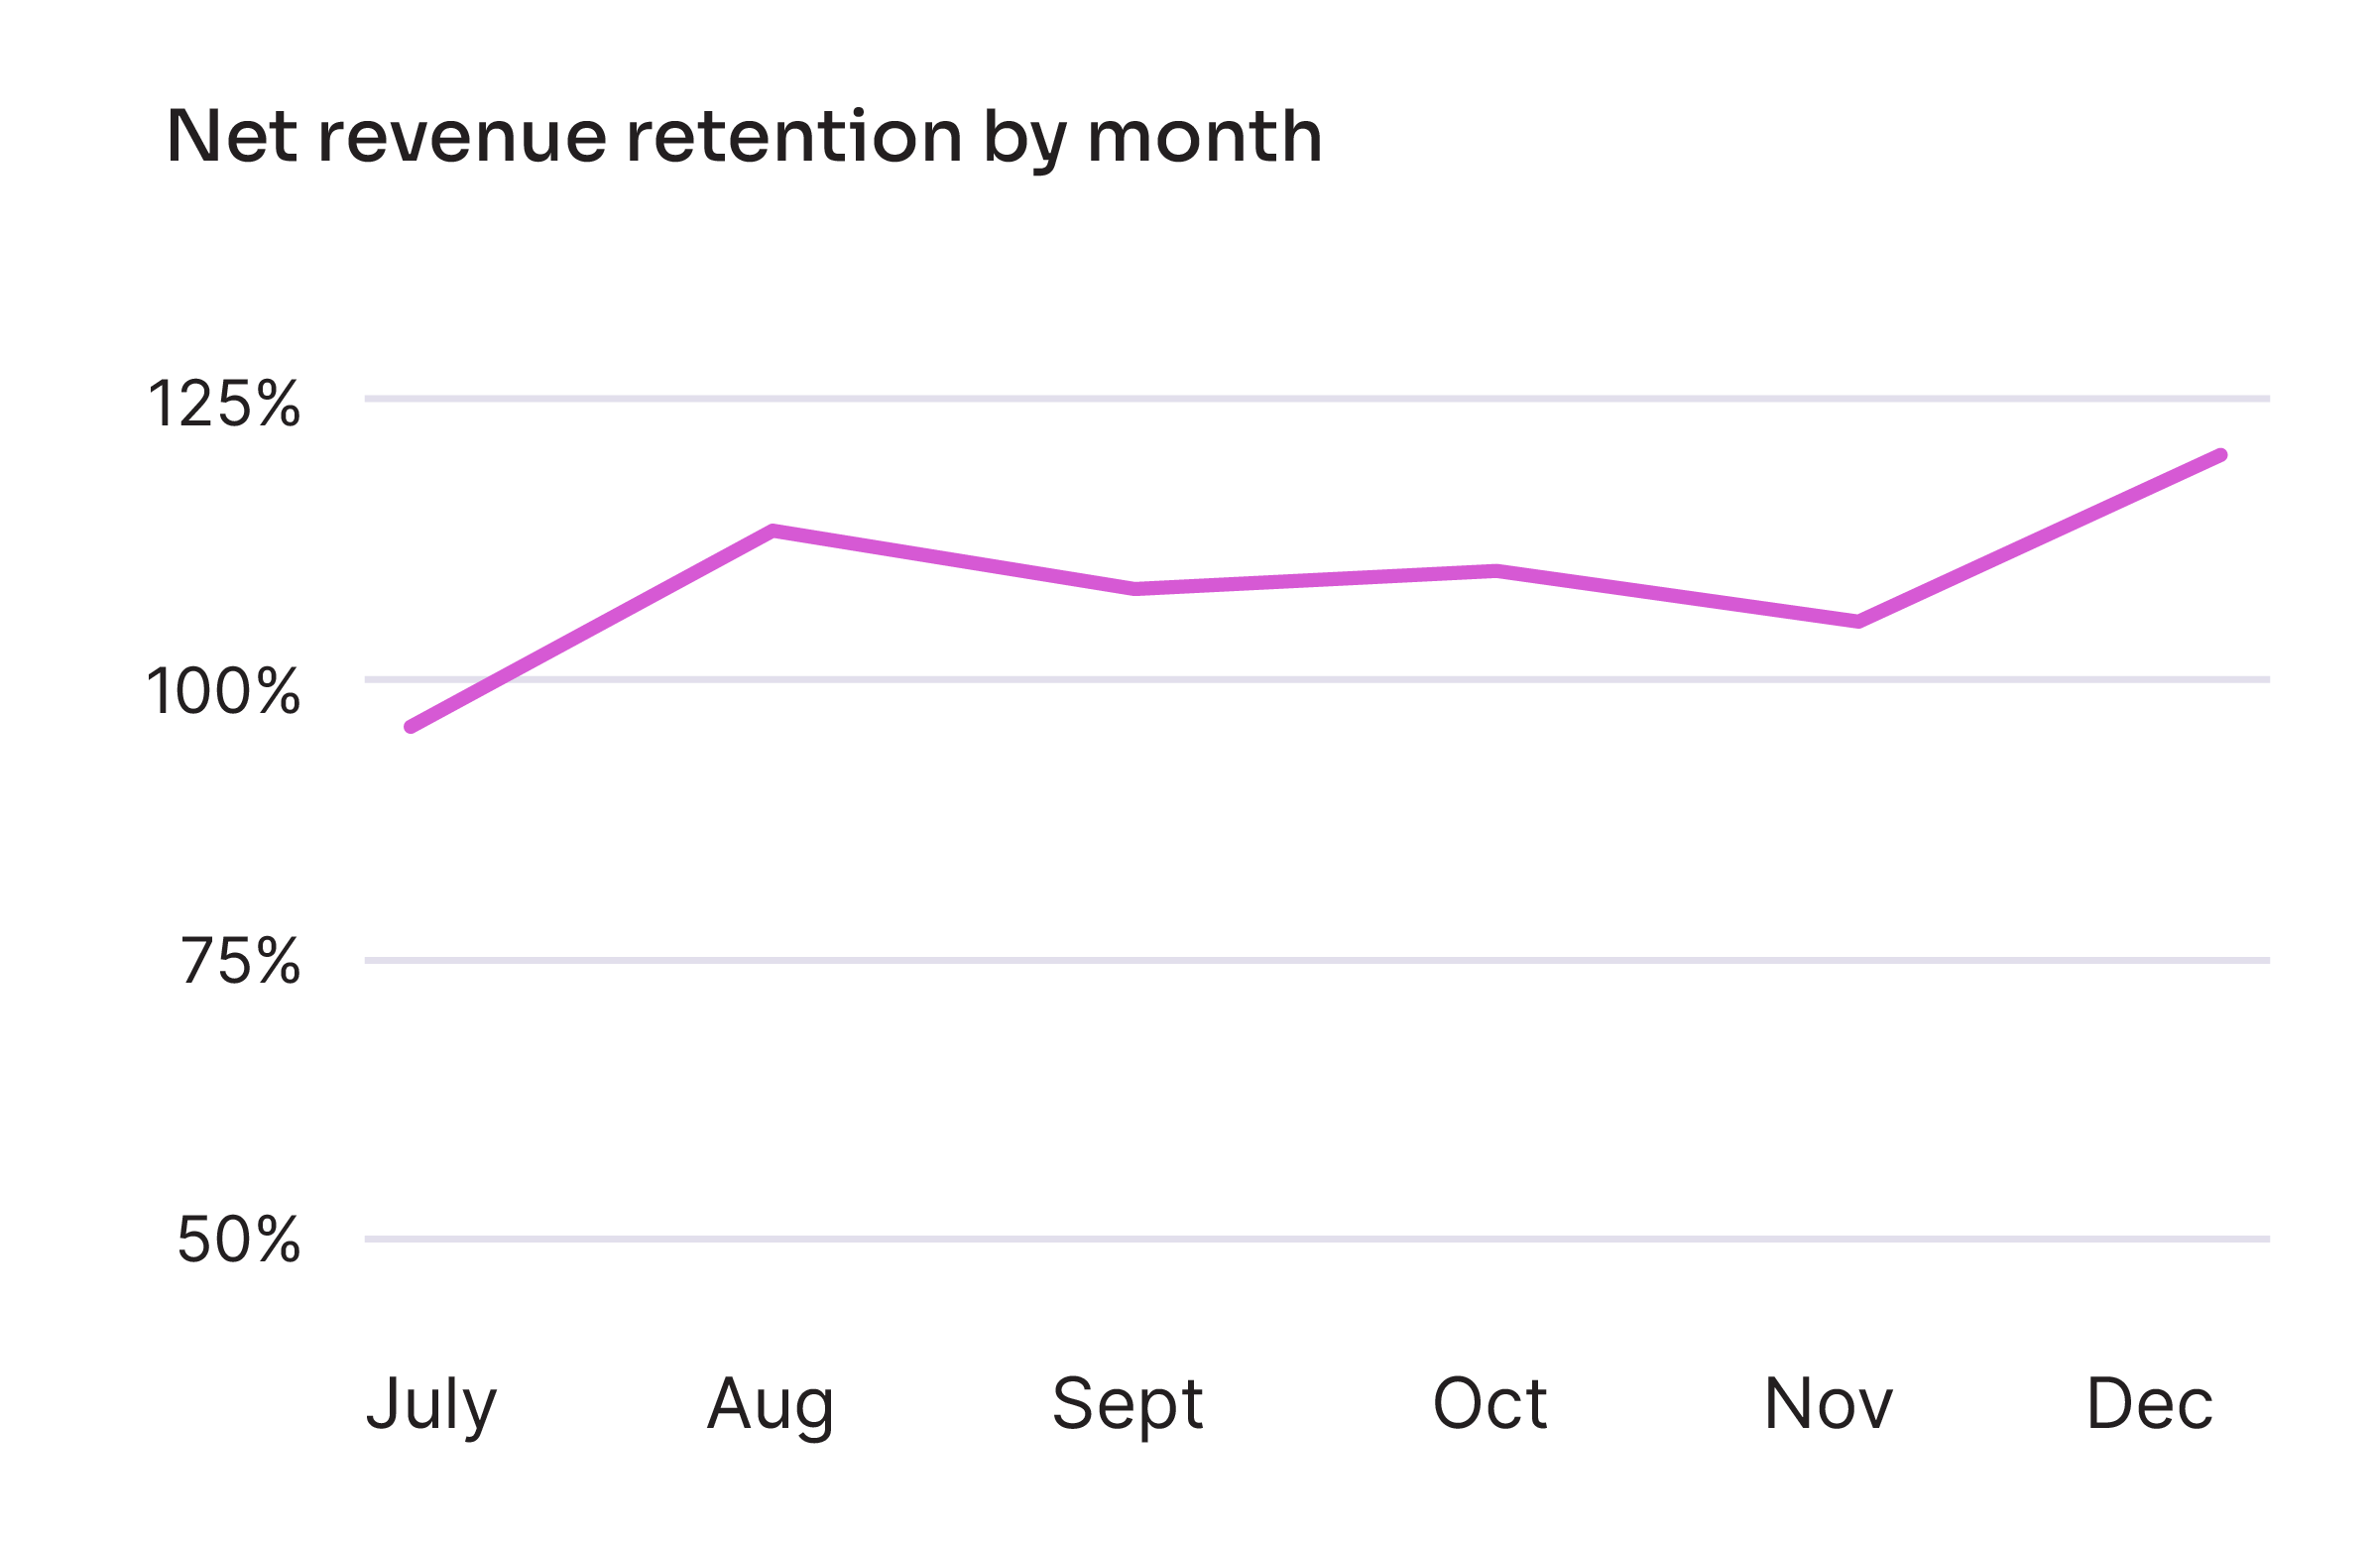
Companies usually track NRR monthly or yearly, but we advise looking at your net revenue retention each month so you always have a sense of any fluctuations.
Why NRR matters
NRR is a particularly valuable metric to track because it is all-encompassing—it takes revenue, expansion, and churn all into account. Product teams should always be looking to increase net revenue retention since it represents key goals of expanding customer value and minimizing churn. And there’s no question executives, investors, and the rest of your company will want to know how much revenue your product is able to generate and retain.
2. Adoption
Are users adopting the product and key features within it?
Product usage
Adoption is an activation metric that measures how many users interact with your product (product adoption) or specific features within it (feature adoption). By understanding how (or if) customers adopt and use your product, you’ll have a clear sense of whether the product is delivering on its intended value.
How to measure adoption
As mentioned above, there are two types of adoption: product adoption and feature adoption. Here’s a breakdown of how to measure each:
Overall product adoption
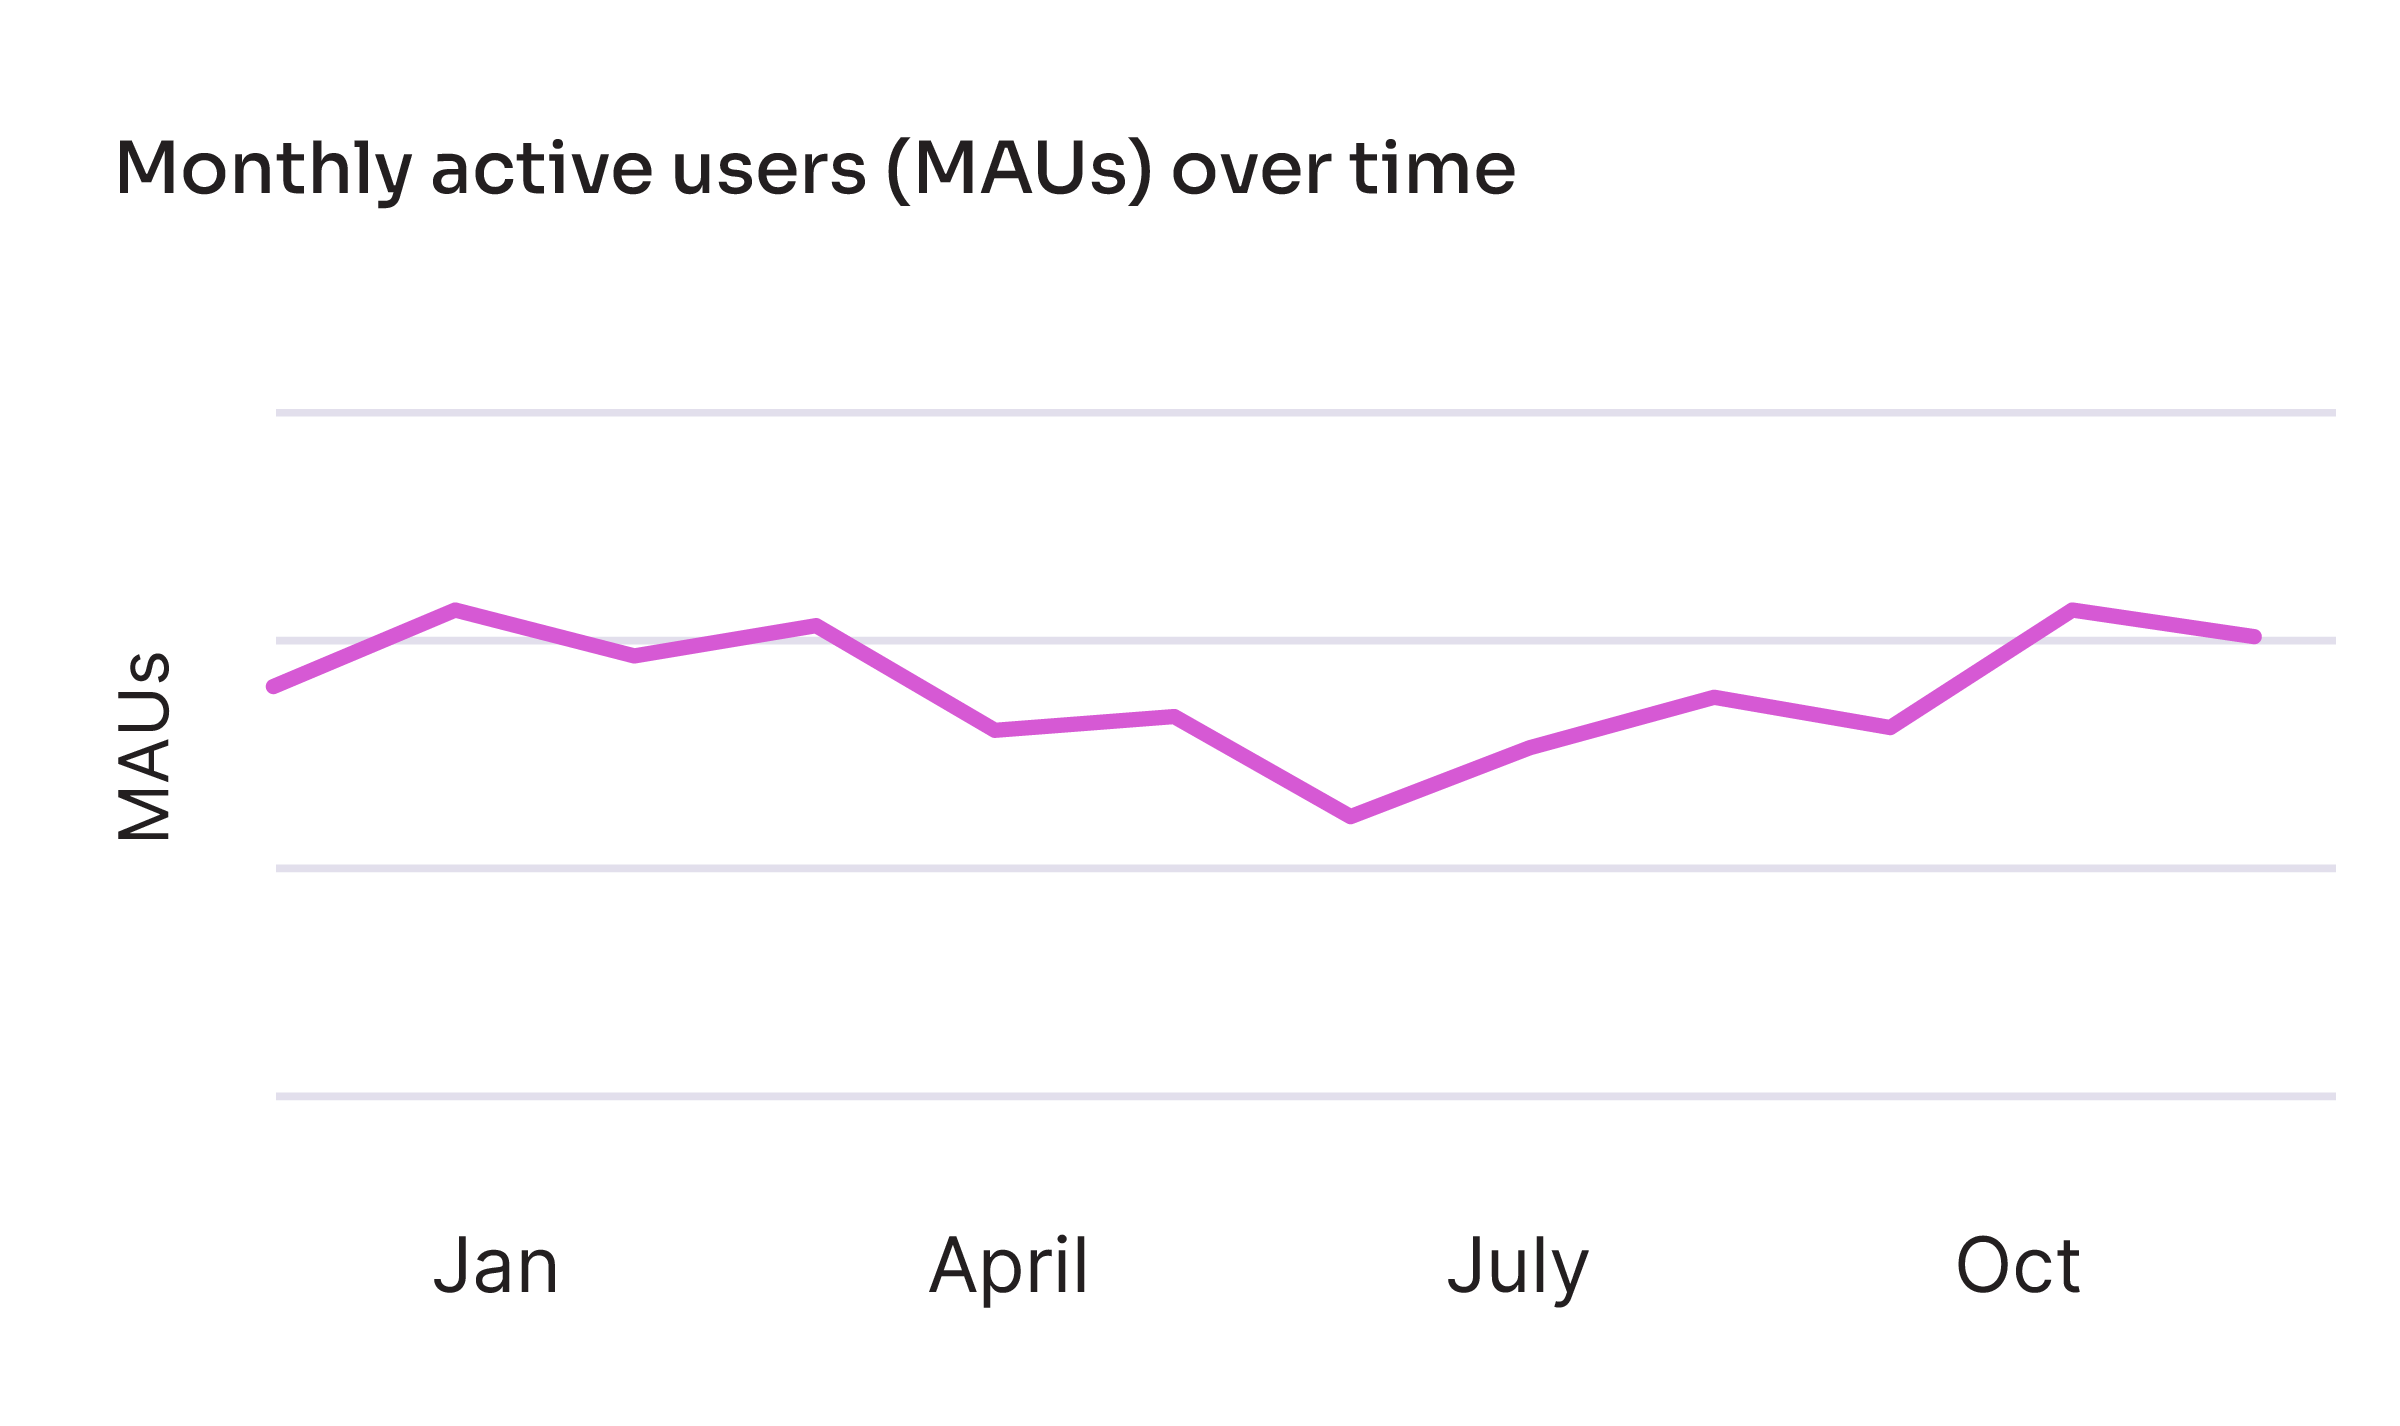
Product adoption can be expressed over time by the number of monthly active users (MAU), weekly active users (WAU), or daily active users (DAU). You can also measure product adoption as a rate relative to new user signups for a given period of time. The way you choose to measure product adoption will largely depend on what it means to be an active user of your product. If your software is one customers should be accessing every day, a DAU metric might make the most sense. Or, if your product is B2C, you might want to look at frequency of conversions (e.g. purchases) or time spent in the app.
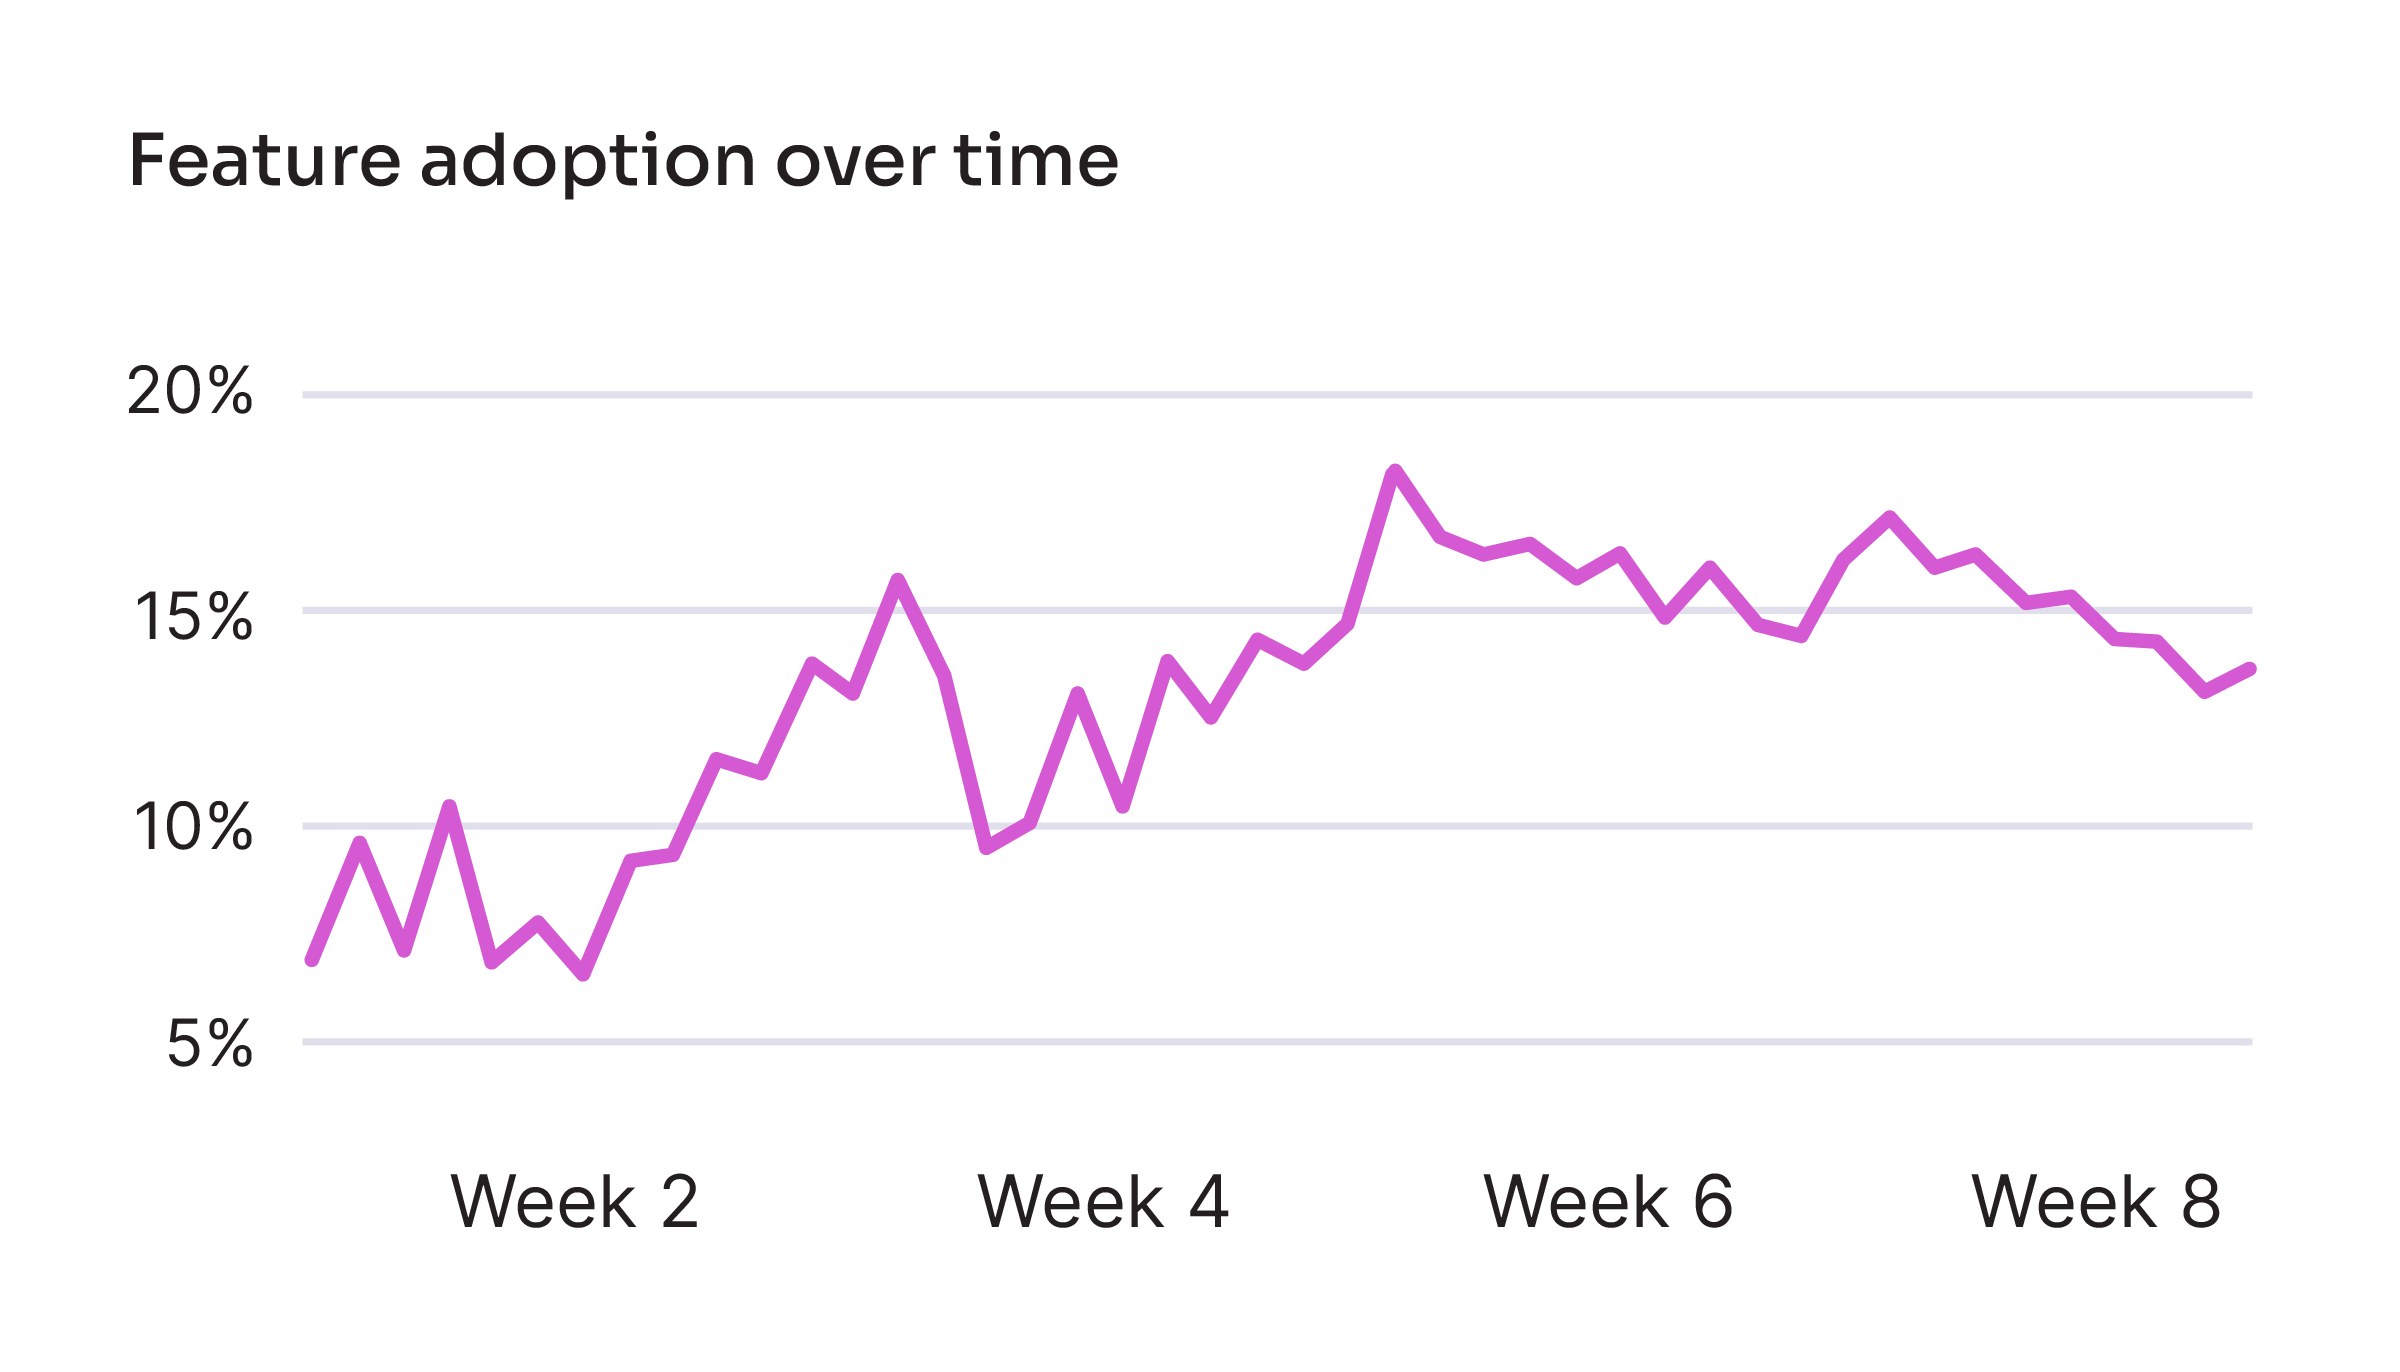
Individual feature adoption
Measuring feature adoption is similar to that of product adoption, except you instead track a specific feature (or features) within the product. One common way to track feature adoption is by the percentage of features that generate 80 percent of click volume.
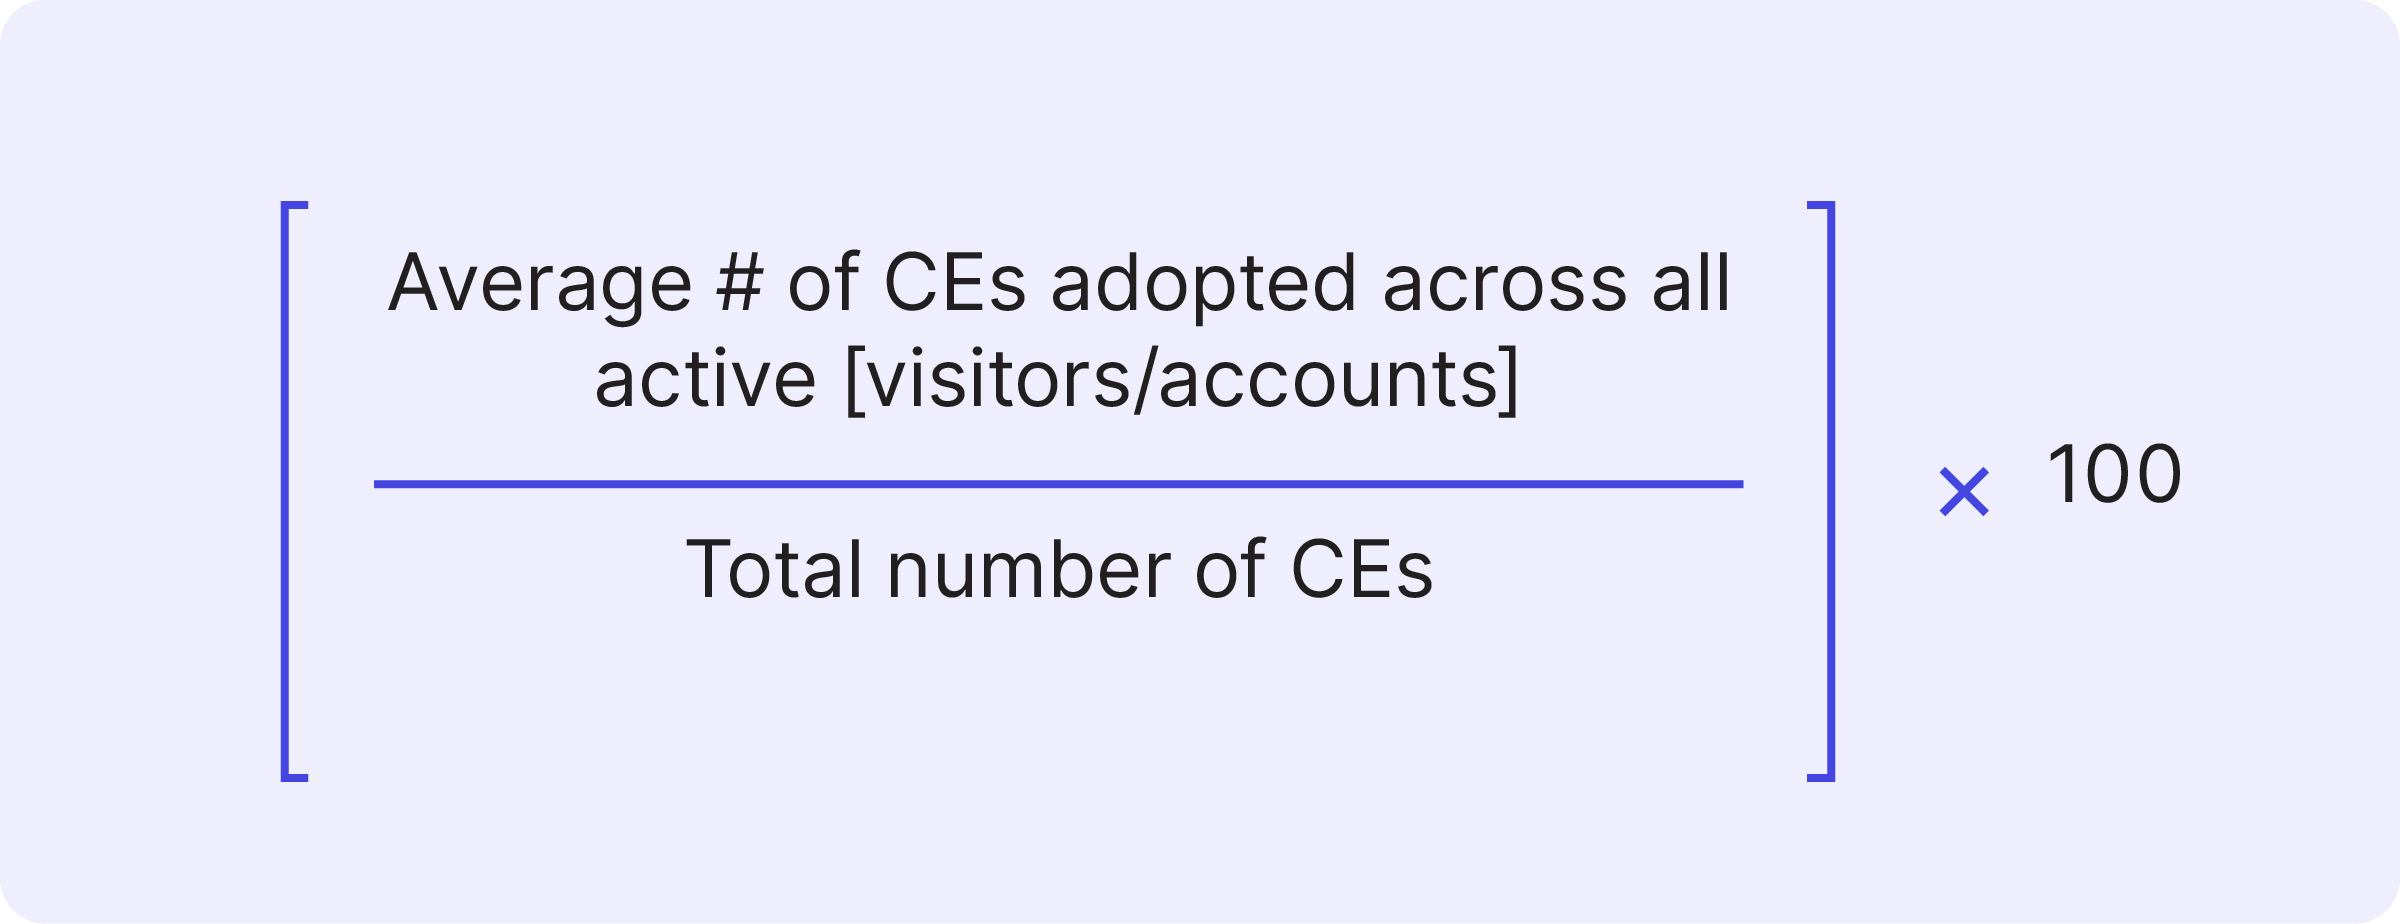
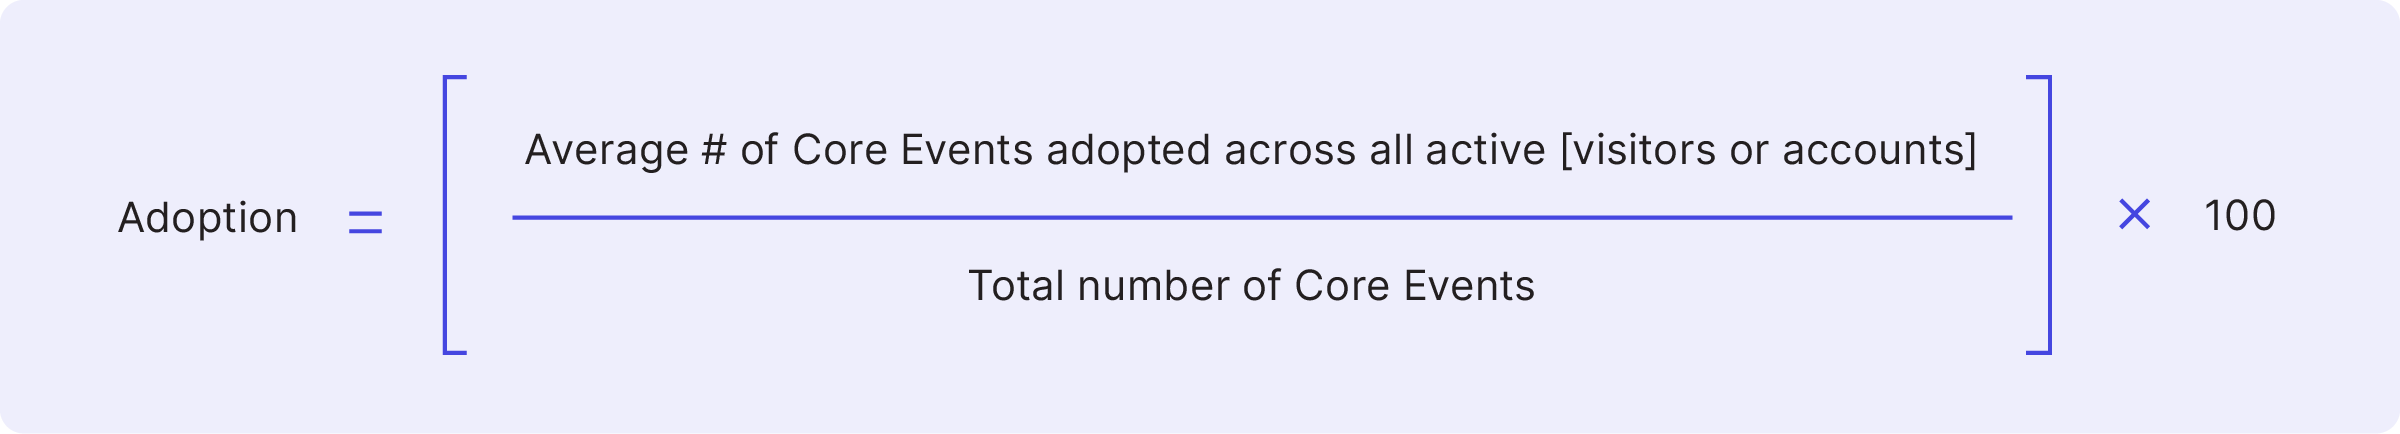
At Pendo, we recommend measuring feature adoption through the lens of your product’s most important features, also known as its Core Events. By focusing feature adoption around the core parts of your product, you’ll have a direct view into whether customers are adopting the features that are associated with positive outcomes. Once you’ve established your Core Events, you can measure feature adoption using this formula:
One key time to measure feature adoption is after you’ve launched a new feature. Use your product analytics tool to look at what percentage of users initially adopted the feature and, more importantly, how many continued to use it after your promotional campaign tapered off. We suggest looking 30 days after a launch to understand drop-off patterns.
It’s also valuable to examine feature adoption at the user level and the account level. While measuring at the user level will allow you to better understand the behavior of your target persona, measuring feature adoption at the account level (i.e. by company) will help you separate out those who may not have needed the functionality because of their role or permissions level.
Why adoption matters
The shift to software as a service (SaaS) puts added pressure on teams to deliver product experiences that keep users engaged for the long haul. Otherwise, come renewal time there’s not much stopping customers from abandoning your software and finding an alternative. Product and feature adoption are important windows into whether users are discovering a product’s value, and both metrics correlate with retention and expansion. In the most basic sense, adoption is a leading indicator of a healthy software product (and company).
After launching a new feature, MineralTree realized the feature’s placement in their application was making it difficult for users to find. In order to improve adoption, they leveraged an in-app guide to “reposition” the feature on their dashboard page—helping users easily locate the new functionality from the page they visit most often. Since launching the in-app guide, MineralTree has seen a 75% to 100% increase in traffic to the new feature. See how they did it.
3. Stickiness
Do users keep coming back to the product?
Product usage
As a product leader, you need to build software that not only attracts new users, but ensures those users stick around and continuously engage with the product. One way to understand if you’re doing this is through stickiness, which measures how many users return to the product on a regular basis.
How to measure stickiness
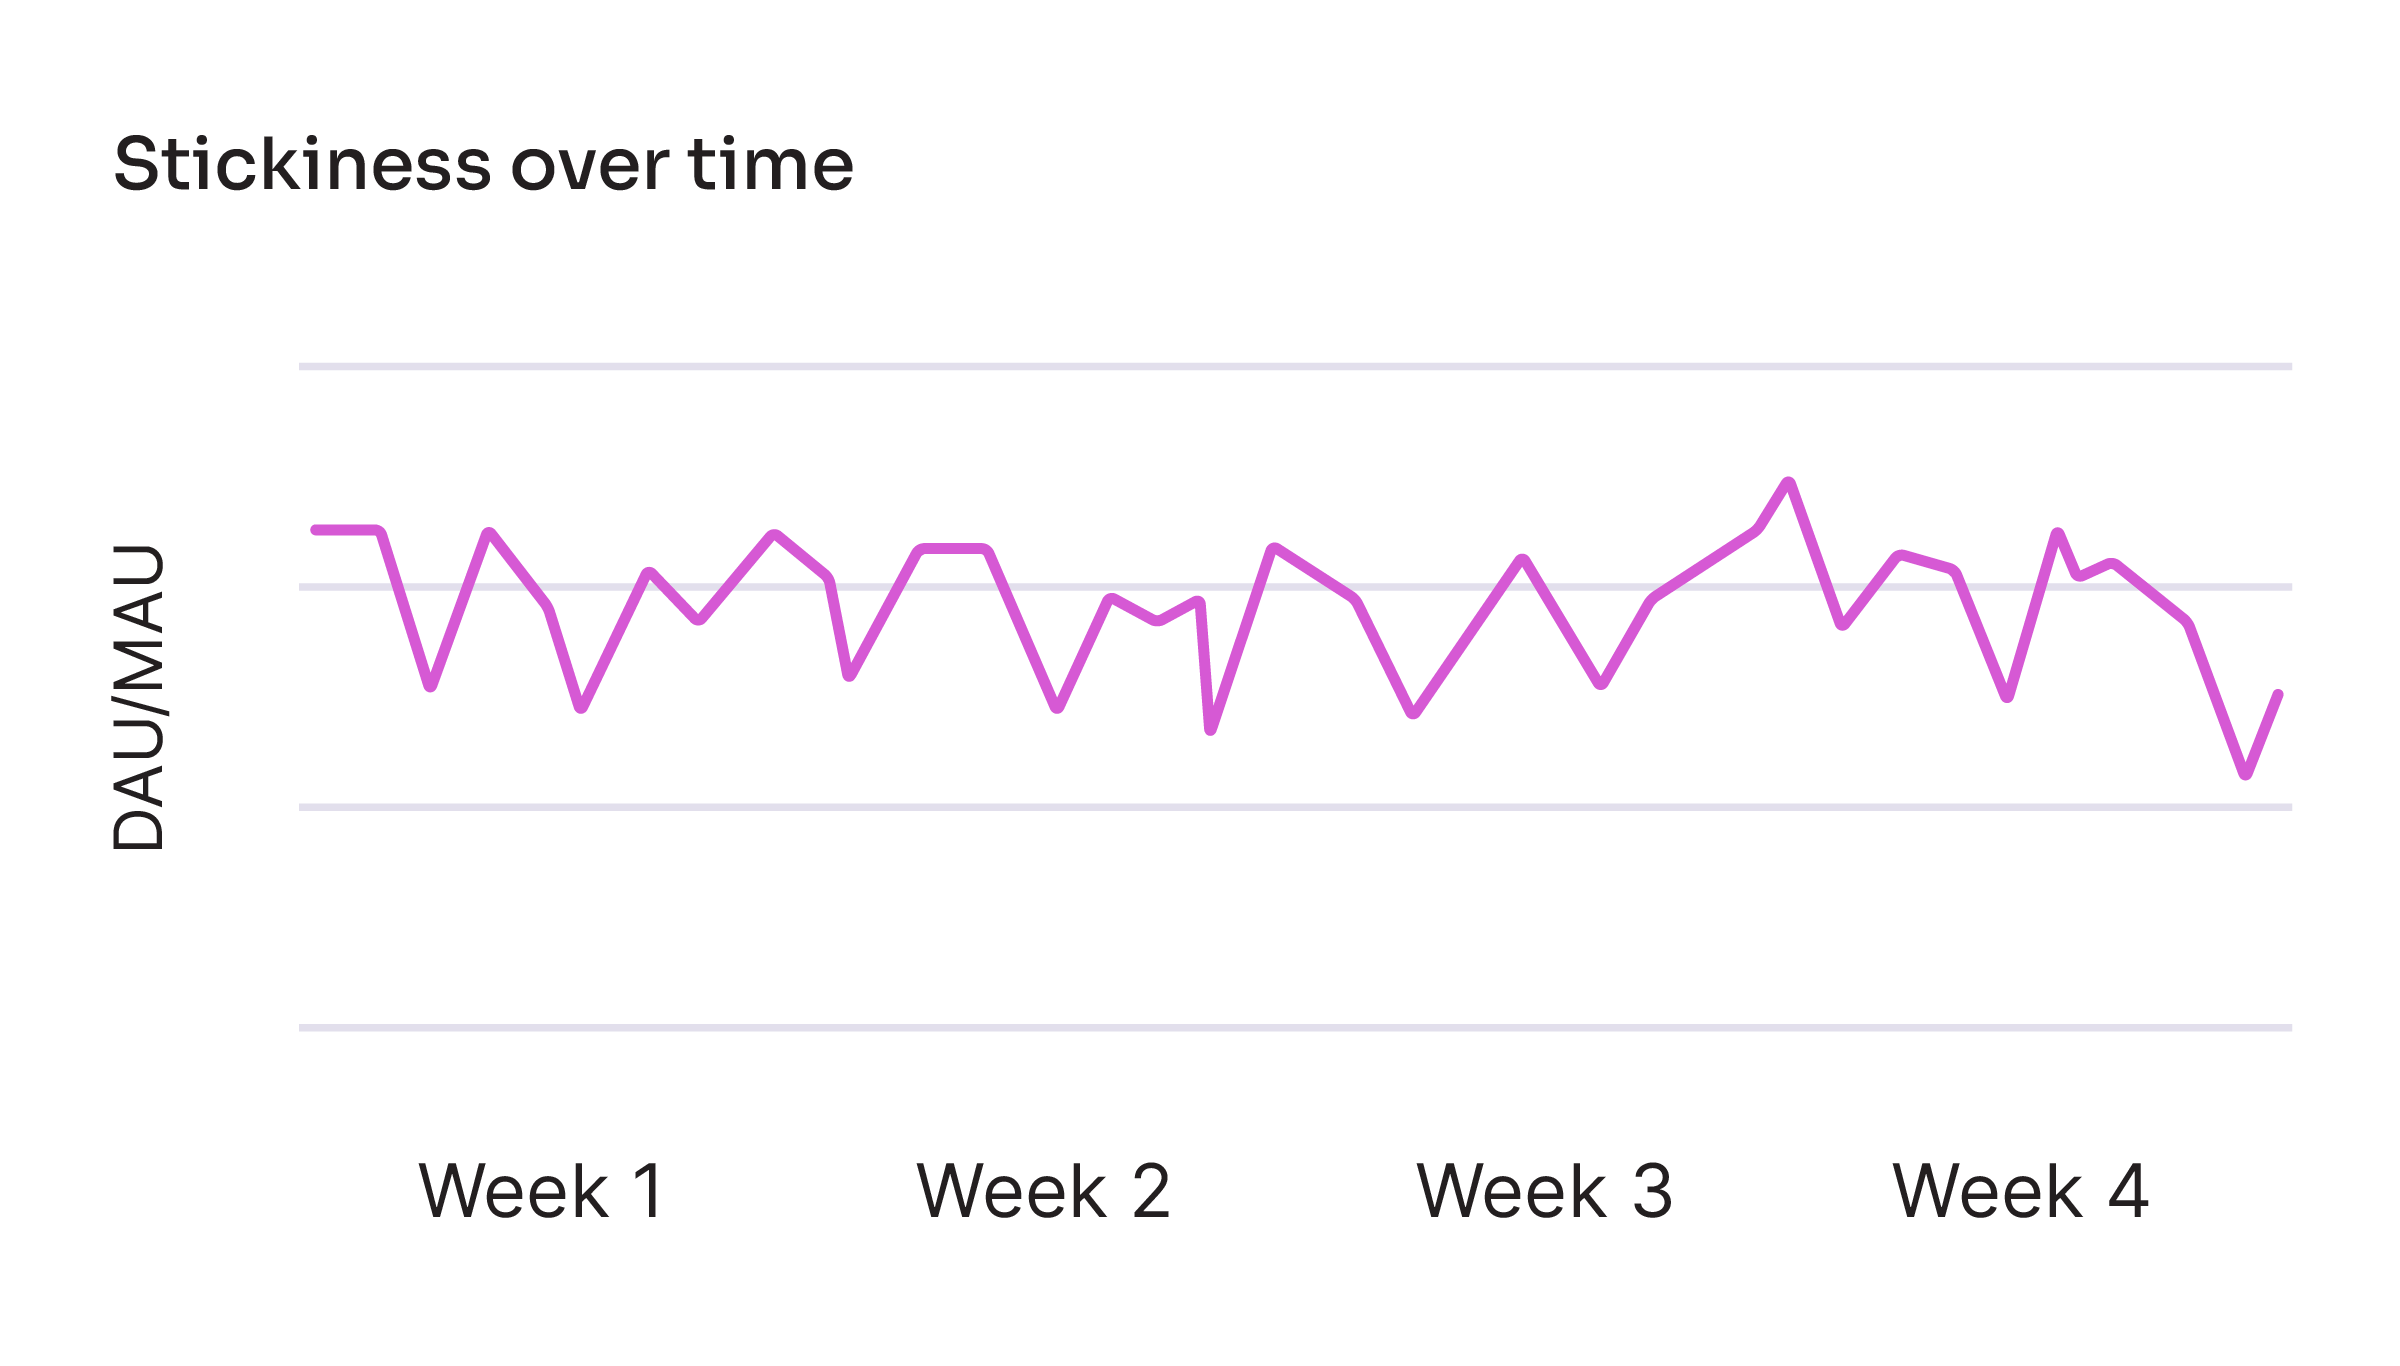
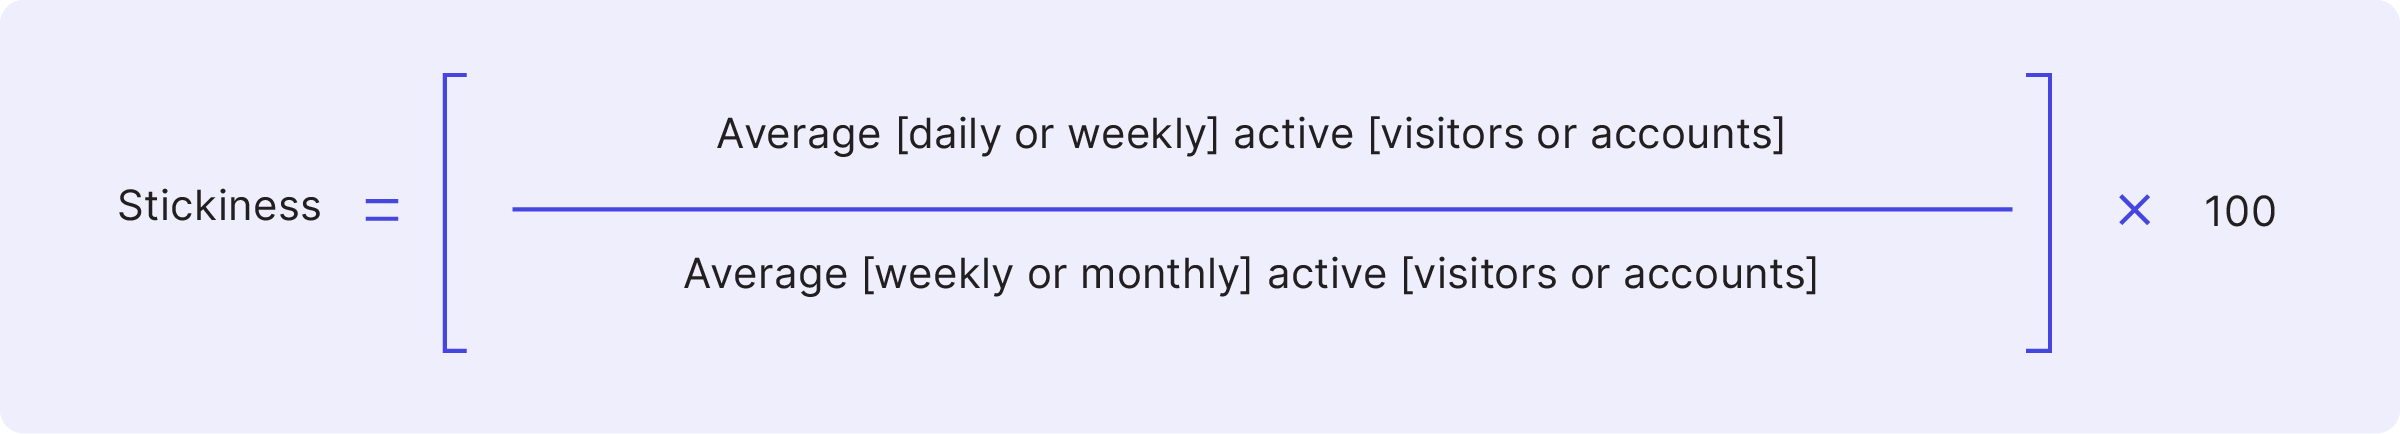
The best way to measure stickiness is through a ratio that can be calculated three different ways:
- Monthly users who return daily (DAU/MAU)
- Weekly users who return daily (DAU/WAU)
- Monthly users who return weekly (WAU/MAU)
To determine which ratio to use, start by identifying what ideal engagement with your product looks like. Some products (e.g. a project management tool) are meant to be used daily, while others (e.g. a healthcare patient portal) are geared toward weekly or even monthly usage. Once you’ve determined your product’s ideal engagement levels, you can select the stickiness measure that aligns best with your needs.
Why stickiness matters
Save for the rare type of software application that’s only meant to be used once (or a few times), every product manager wants users to continue engaging with and finding value in their product. Stickiness not only helps you quantify how frequently users return, it also provides valuable insight that you can use to drive higher engagement across your user base. For example, after examining the behaviors of your highest-frequency users, you can then encourage similar workflows (e.g. through in-app guides and walkthroughs) with the rest of your users.
4. Growth
Is the product acquiring and retaining new users faster than existing users are abandoning it?
Product usage
Growth measures the net effect of your user acquisition and retention efforts. Whether it’s achieved by adding new accounts or increasing usage within existing accounts (or ideally, both), growth is a common top-line metric for modern product teams—and a key indicator of product engagement.
How to measure growth
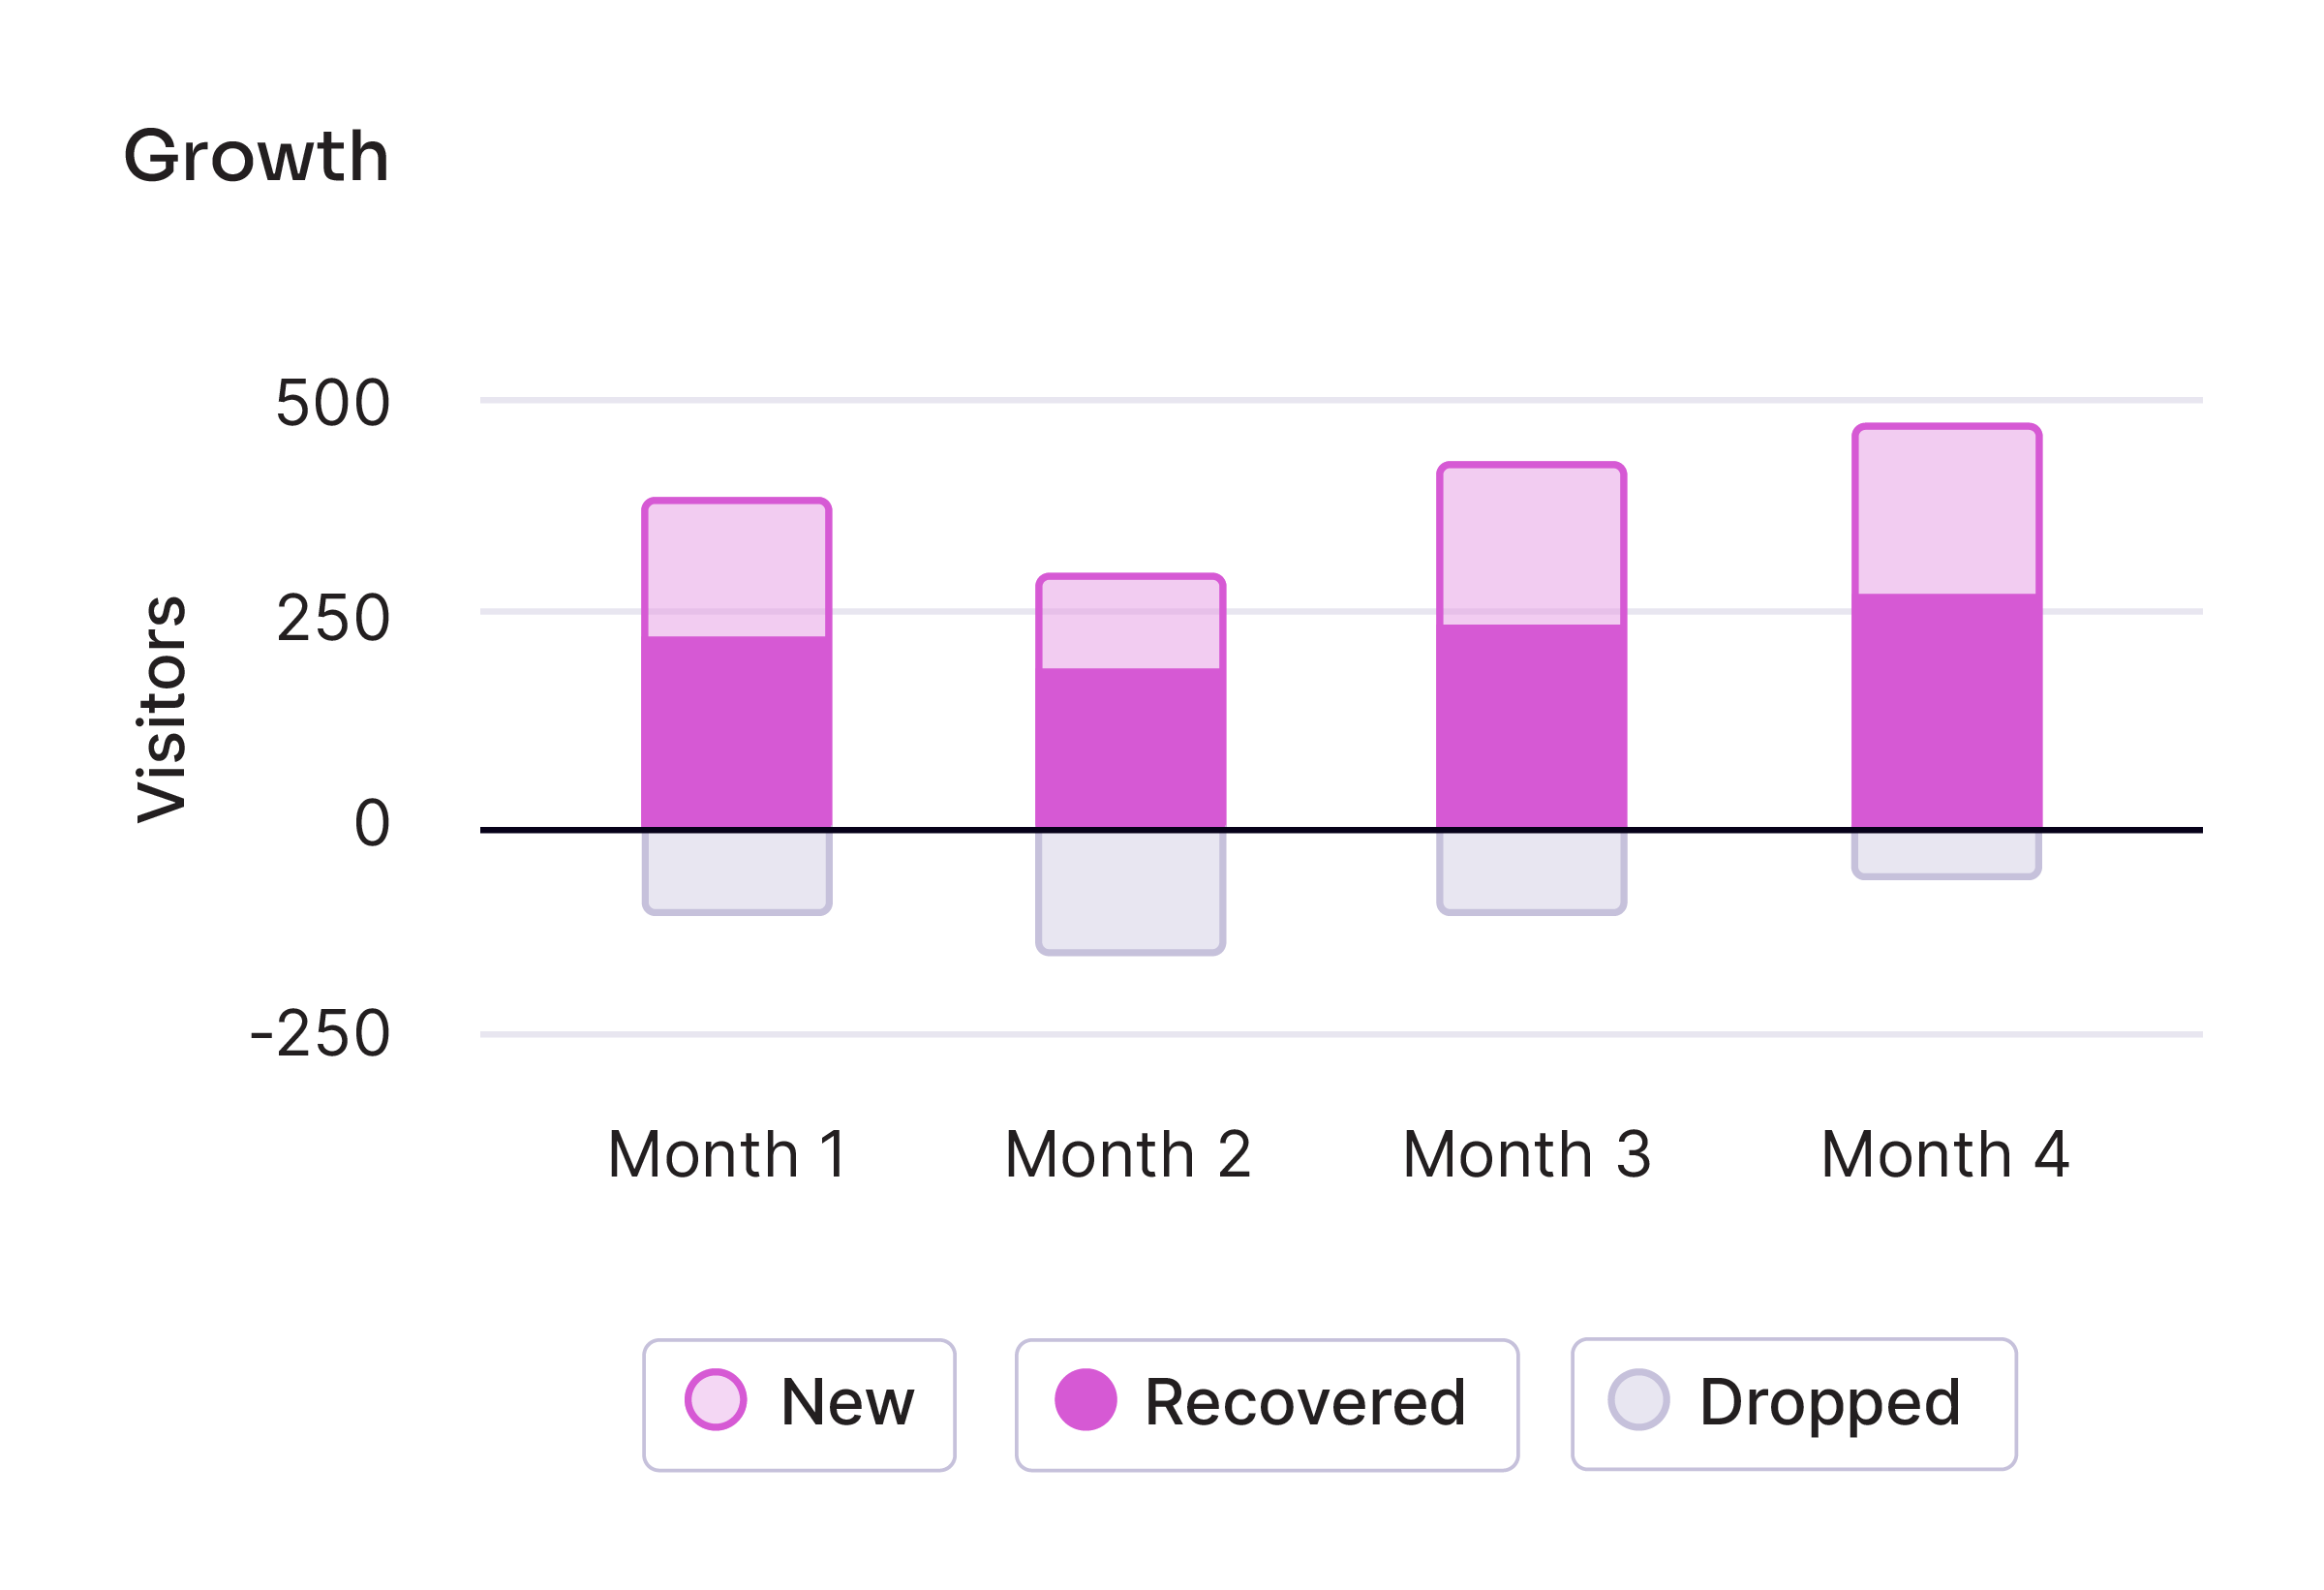
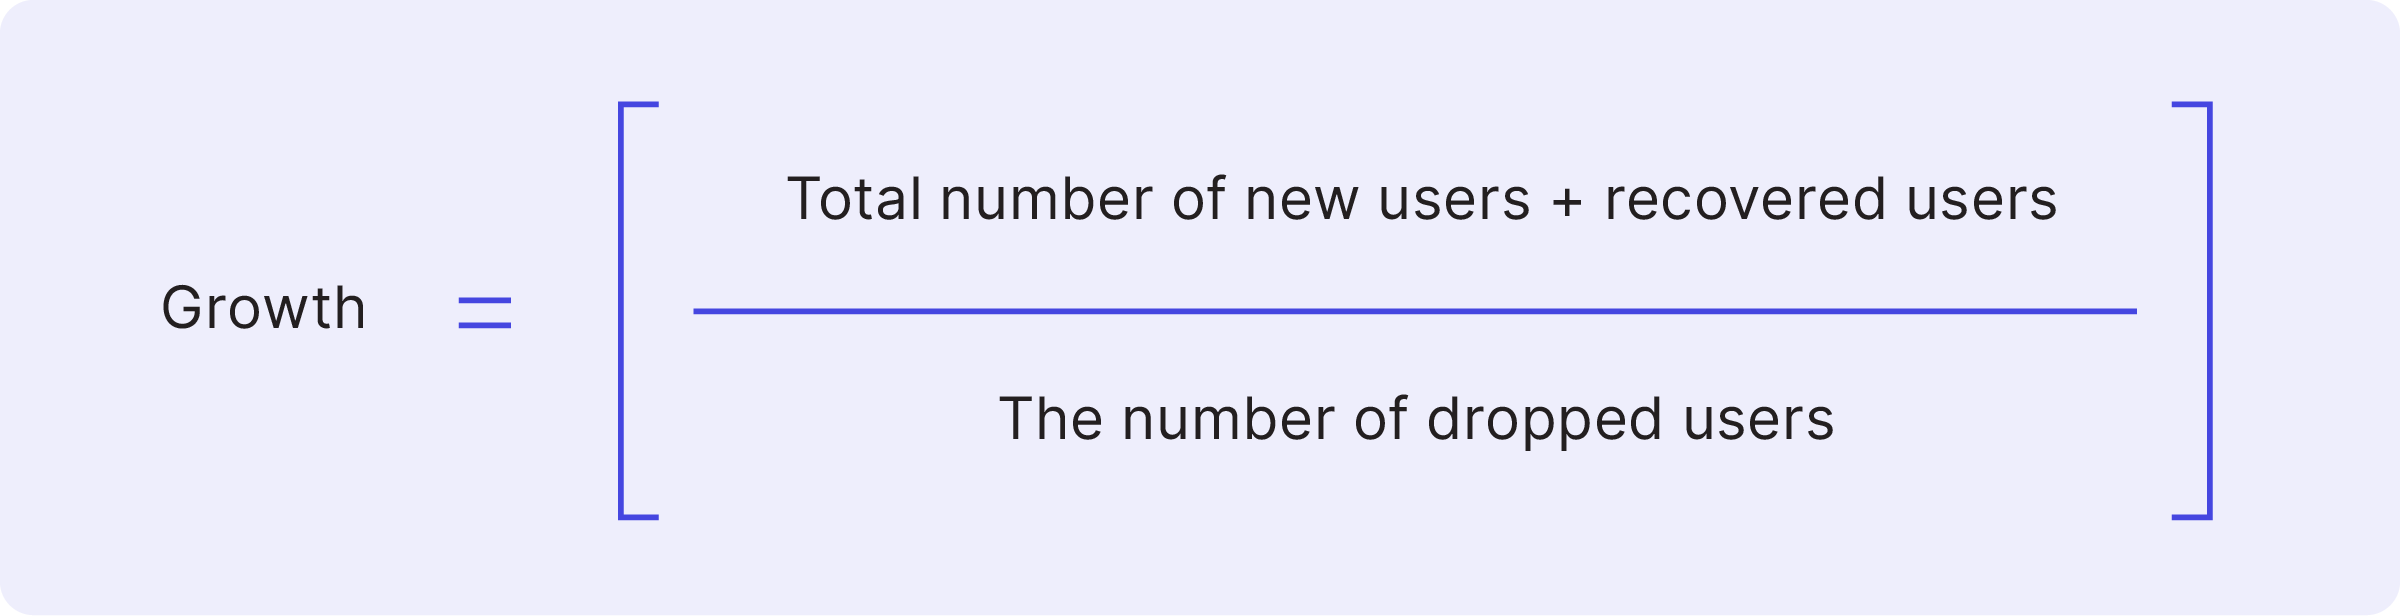
One of the simplest ways to measure product growth is to track the percentage growth of users or accounts within a given time period. At Pendo, however, we use Quick Ratio to measure growth because we think it best captures user growth, retention, and churn in one easy number. In short, Quick Ratio describes how efficiently your product is growing. You can think of it as a way to measure the “heartbeat” of your product, since it shows how many users are joining, staying, and leaving in a given period.
Mathematically, the growth calculation for a given time period looks like:
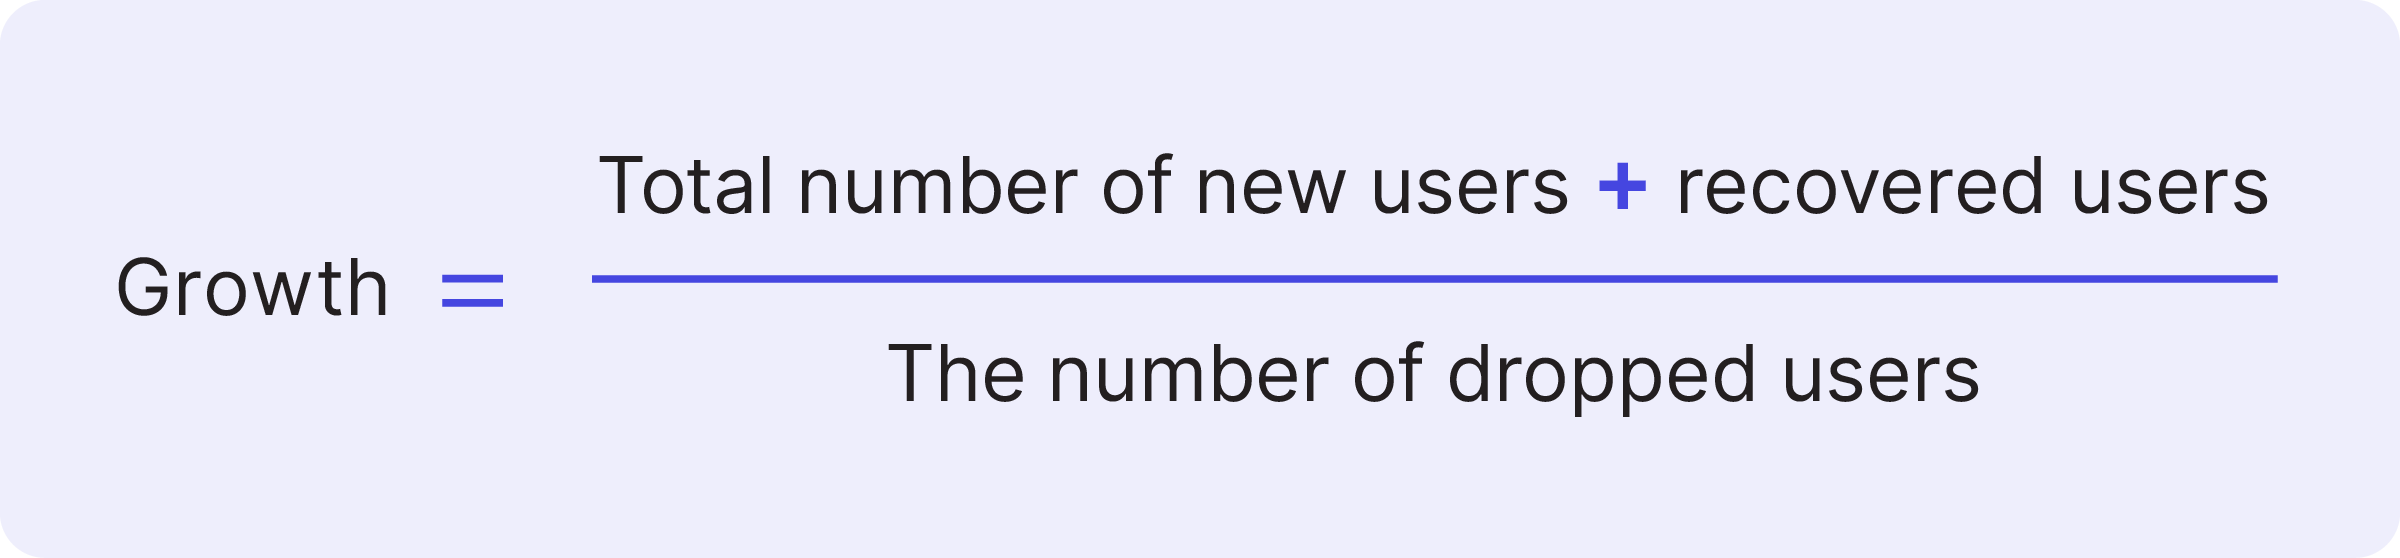
Why growth matters
While it’s easy to get caught up in making the product better, faster, and easier to use, teams still must ground themselves in an engagement metric like growth. If you’re not able to effectively grow your user base—and keep the users you already have—the work you and your team put into improving your product becomes a lot less relevant.
Top Hat’s marketing organization was tasked with helping their peers in customer success with a large renewal campaign. After seeing limited success with email-driven outreach, the team turned to their product itself as a marketing channel, creating in-app guides to automate the renewal campaign and reduce administrative work for their account reps. Learn more about their product-led growth strategy.
5. Product Engagement Score (PES)
How are users engaging with the product overall?
Product usage
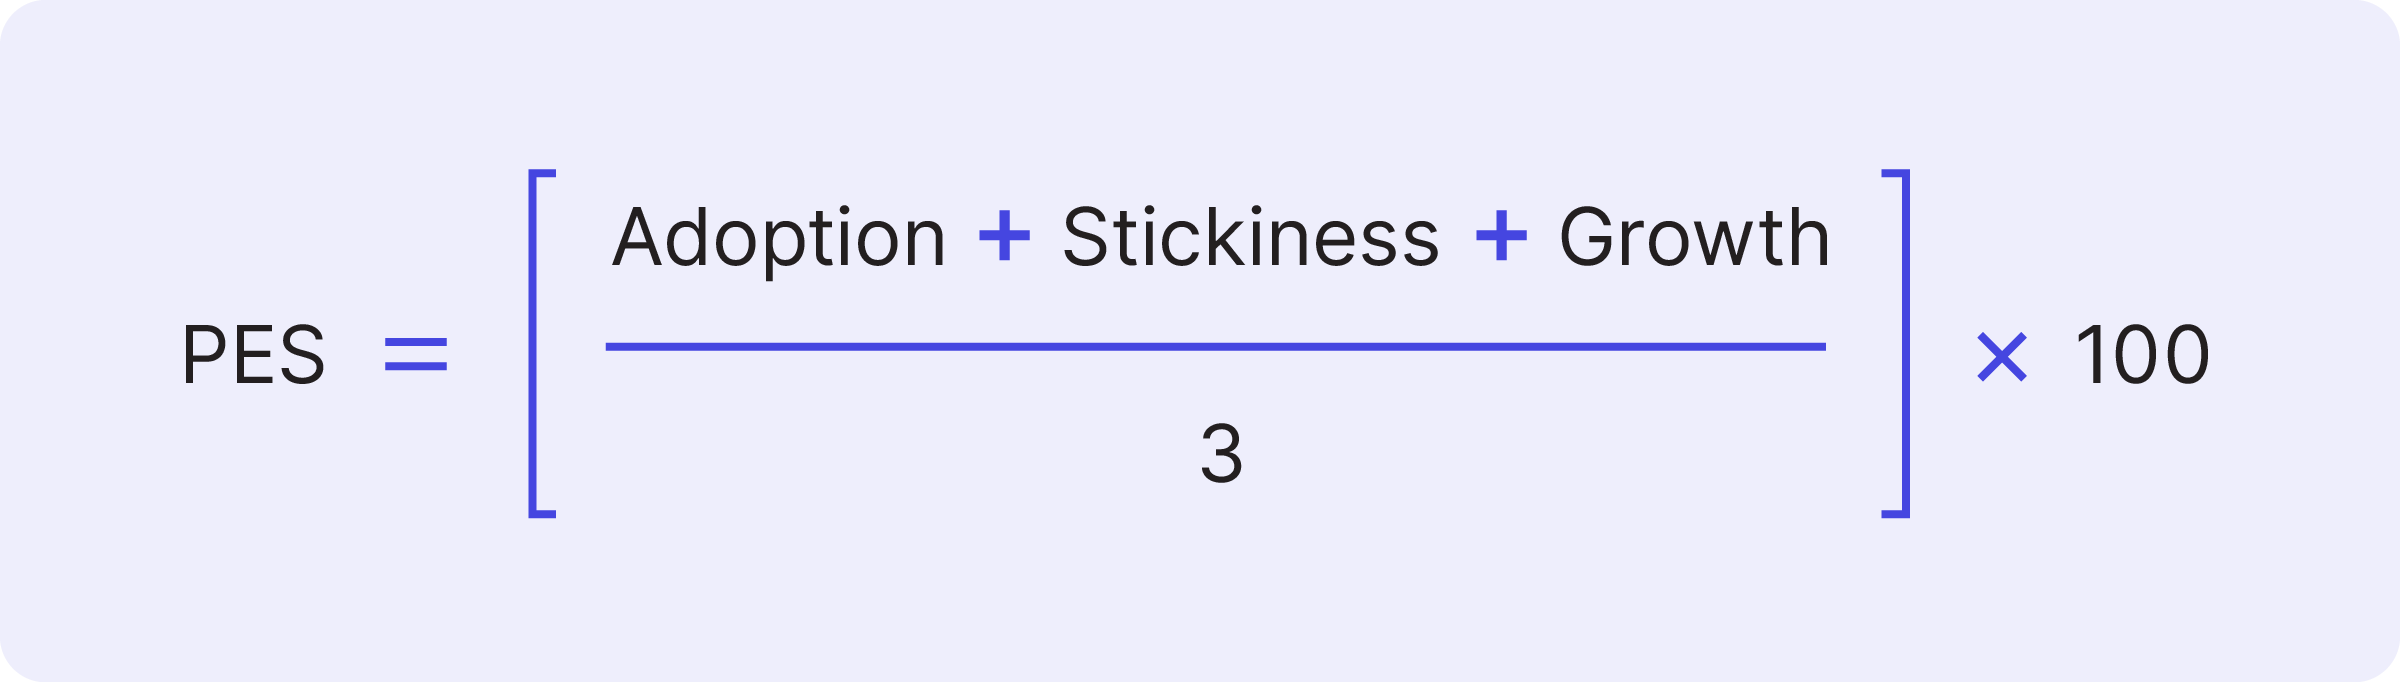
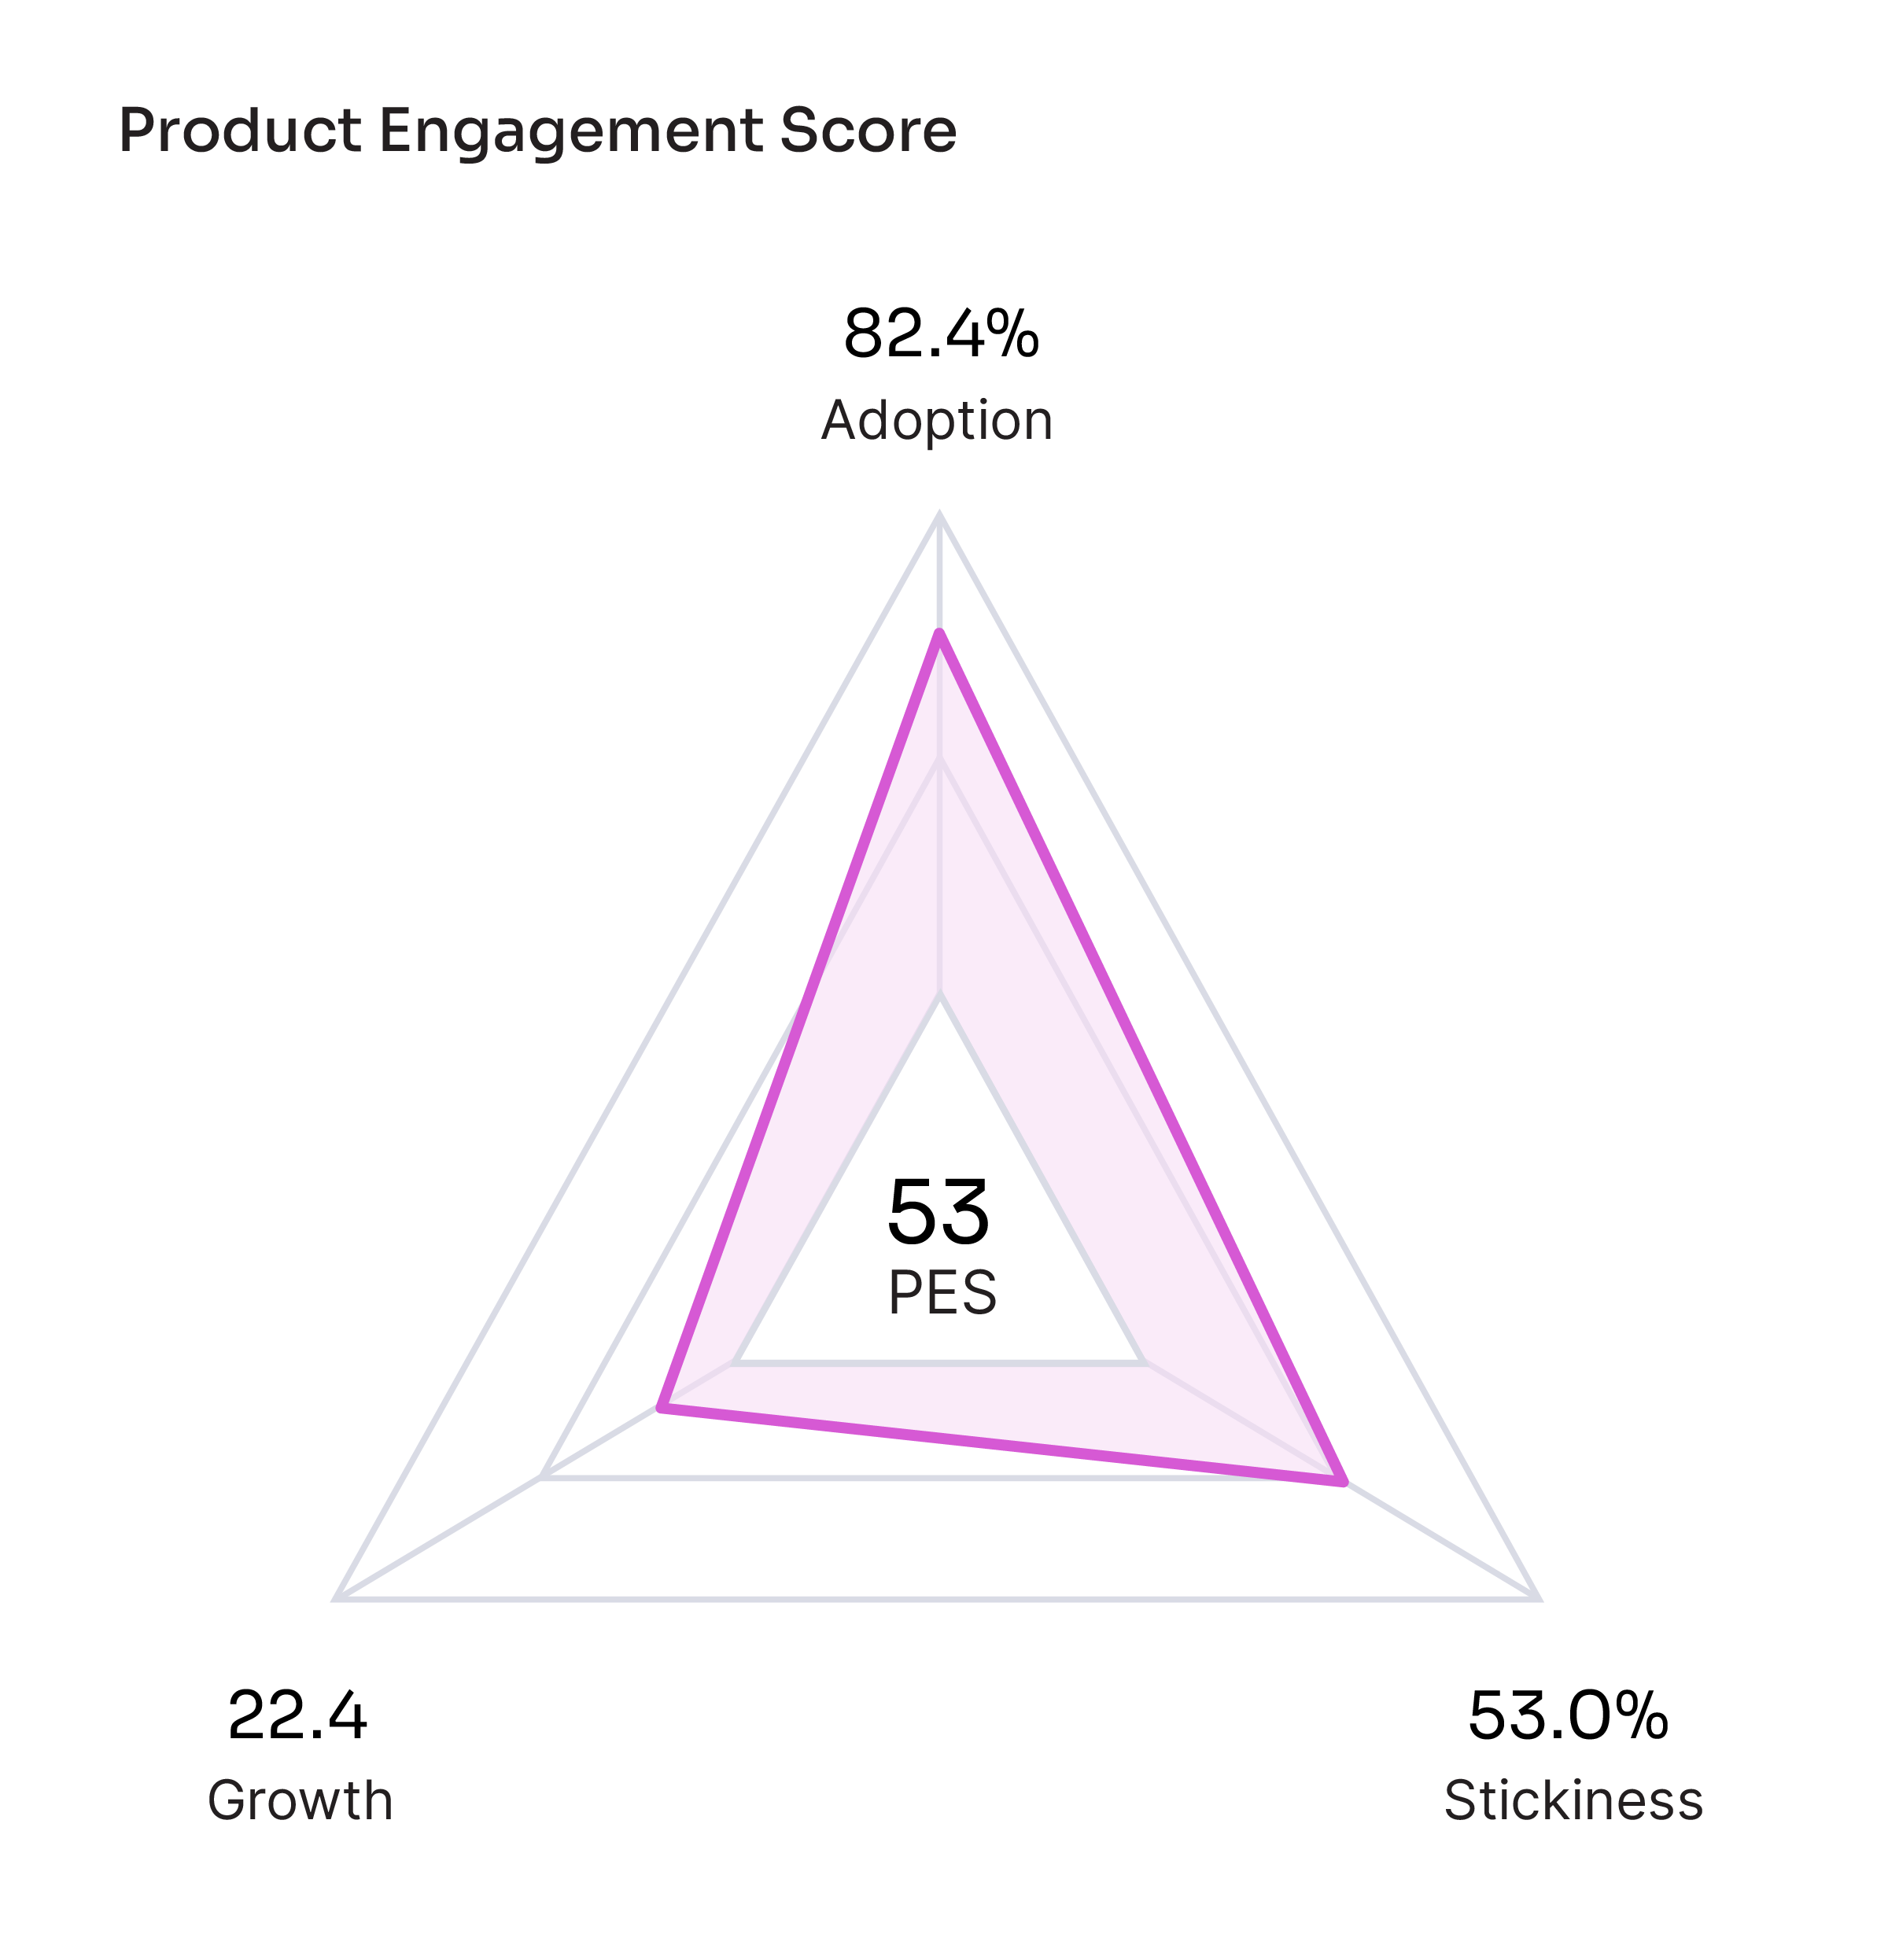
Just as there are many KPIs to measure product success, there are multiple ways to measure product engagement specifically (three of which we covered in the previous sections). The Product Engagement Score (PES) exists to provide product leaders with a single metric to measure how users or customers engage with the product. PES is a composite metric, taking the average of one’s adoption, stickiness, and growth rates. The goal? To make it easy to quickly understand how your product is performing.
Here is a breakdown of the components of the Product Engagement Score:
How to measure PES
Once you’ve calculated values for adoption, stickiness, and growth, you can calculate your PES by simply taking the average of the three numbers and multiplying by 100:
You can choose to measure your Product Engagement Score based on visitors or accounts. If your product is only used by individuals (and not teams), then you’ll likely only want to measure each PES component at the visitor level. If your company is focused on new logo acquisition, measuring growth (and overall PES) at the account level will best reflect those efforts. When in doubt, try to always align your PES configuration with your organization’s current overarching priorities.
Prior to leveraging the Product Engagement Score, IHS Markit’s UX team had to patch together many different metrics to paint a picture of product health. Now, with PES, the team has a single metric they can use to understand product success and friction. PES also provides a common language for teams across the organization to collaborate around things like improving adoption or optimizing onboarding. Here’s a look into their journey with PES.
Why PES matters
One of the biggest benefits of leveraging the Product Engagement Score is that it boils engagement down to one number—giving PMs a single go-to metric for reporting product success. Yet PES is equally useful in helping you understand where you can improve. Since the score takes the average of a product’s adoption, stickiness, and growth values, you can quickly identify which metric (or metrics) is bringing down the average. By digging into each number, examining trends over time, and comparing scores for visitors and accounts, you’ll be able to understand the “why” behind each metric, identify areas for improvement, and experiment with different tactics to boost each component of PES.
Using our own business as a case study, Pendo’s data science team wanted to see if, using only PES metrics, we could predict whether a customer would churn, renew flat, or grow its contract.
The team found that PES is in fact correlated with customer retention. In the months leading up to a renewal, accounts with the highest PES were most likely to renew and expand, companies with slightly lower PES were likely to renew flat, and those with the lowest PES correlated with churn. The separation in scores became apparent around six months before renewal time, which means companies can use PES as a leading indicator for renewals.
6. Retention
Are users building enduring habits inside the product?
Product usage
Retention measures the percentage of users (or customer accounts) still using your product after they initially install or start using it. The two main types of retention are user retention and customer retention: user retention looks at the individual who logs in to use the product, and customer retention looks at the account that pays for access to the product. Another way to think about retention is as the inverse of churn.
How to measure retention
As with measuring adoption, you can measure retention for the product overall, or for specific features. Here’s how to go about each method:
App retention
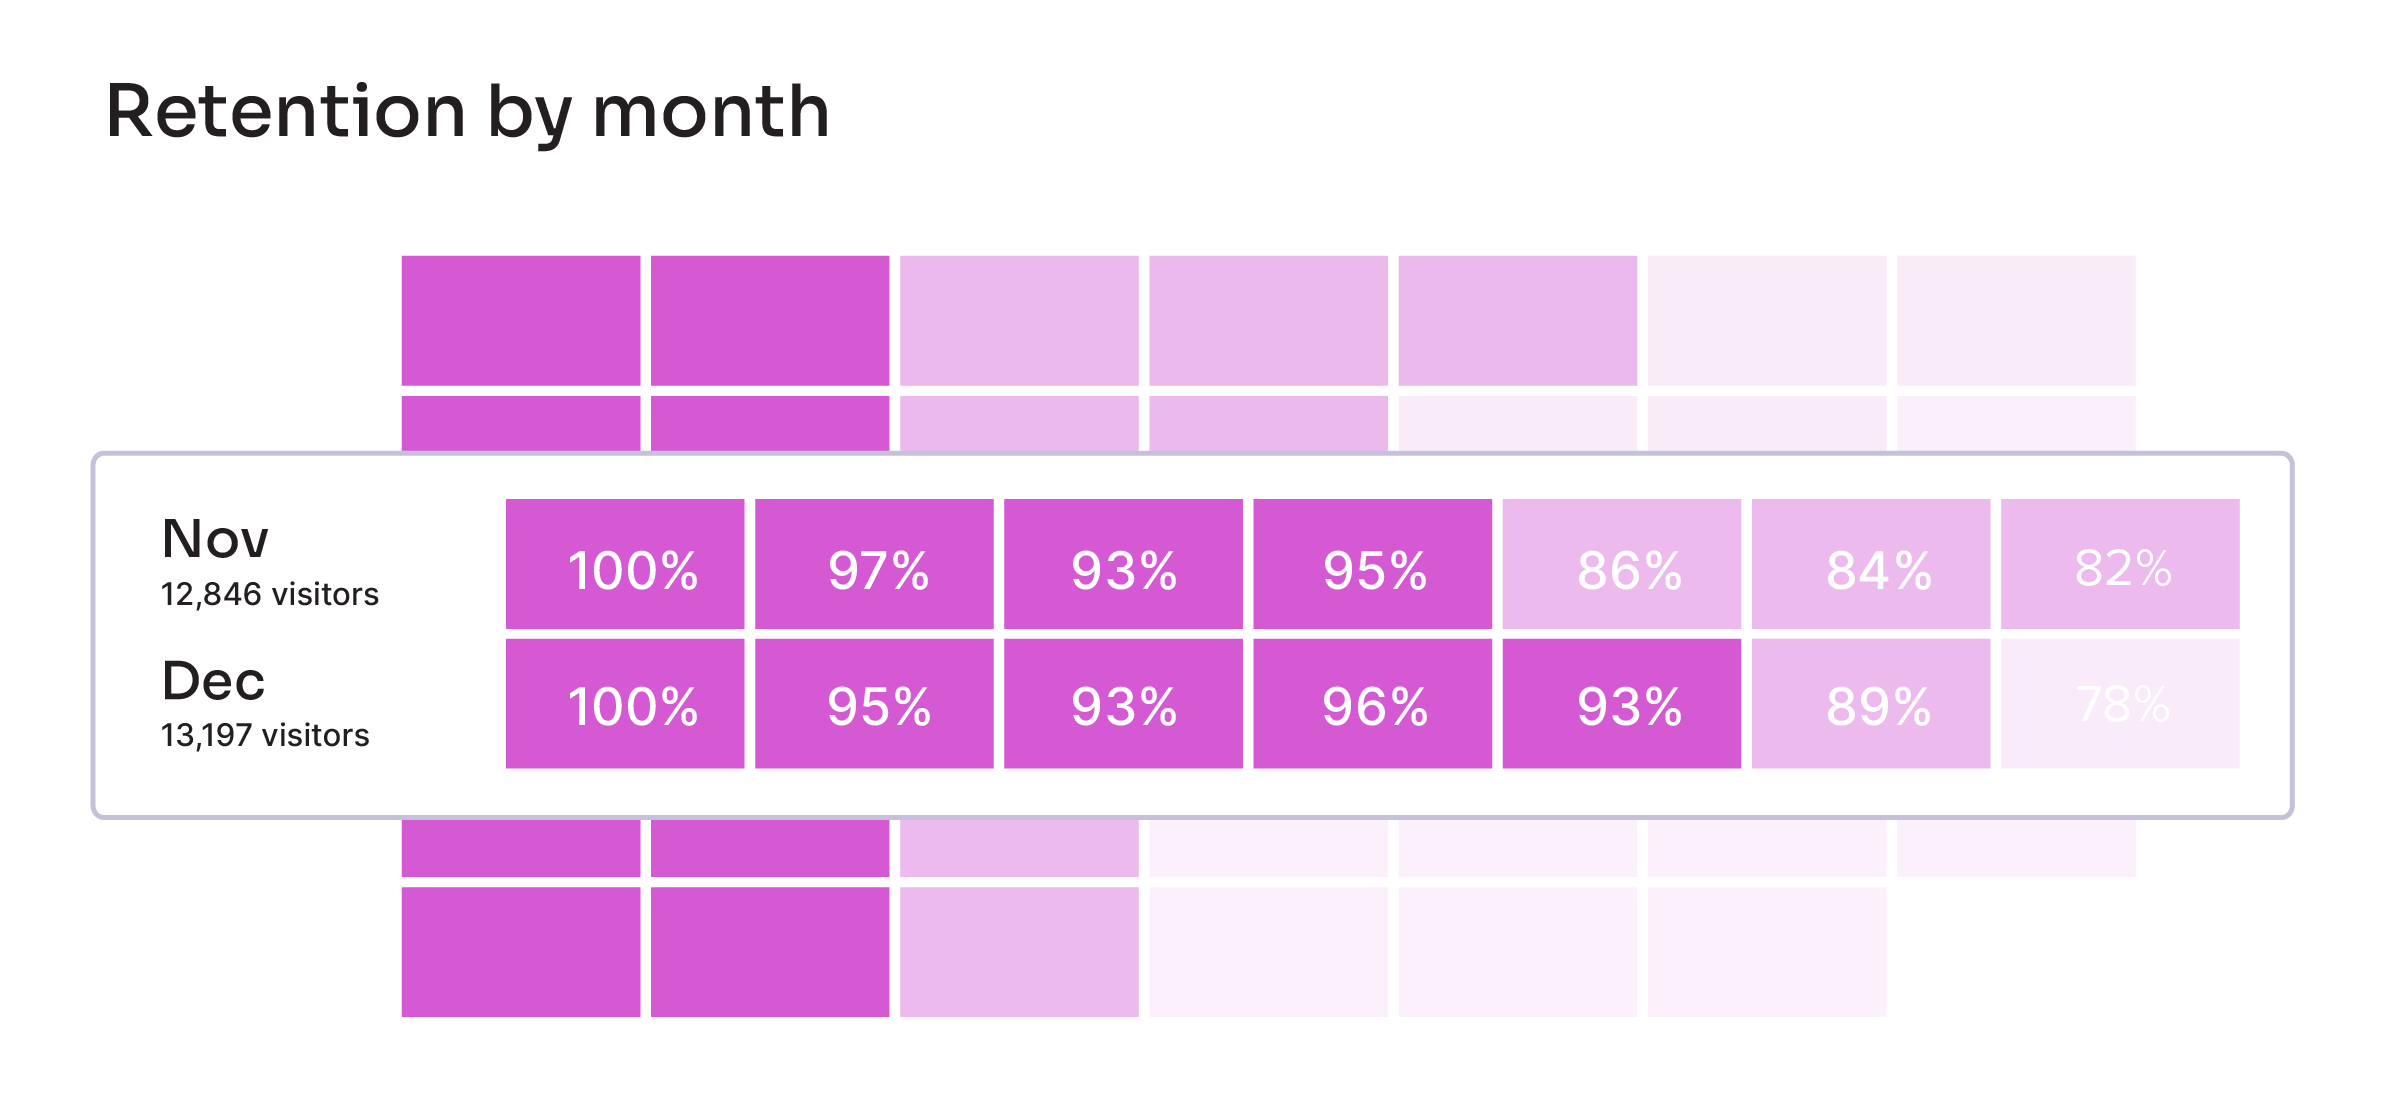
Since product usage data is most valuable when measured over time, app retention measures how many users or customers continue using an application during a given time period, for example the first month of usage, three months of usage, or six months of usage.
Feature retention
Measuring feature retention gives you an understanding of which features keep your users returning and helps you identify any users who are at-risk. The fewer features a user interacts with (and the less often they interact with them), the less likely they are to continue seeing value in your product. If you’ve established Core Events, it might make sense to focus your retention measurement around these key areas of the product.
To take measurement a step further, we also recommend segmenting your data (e.g. by role, company size, or free users vs. paying customers) to compare feature retention across different subsets of users and determine how their behaviors differ.
Why retention matters
If you’re not able to retain customers, it directly impacts your company’s revenue numbers. Since the cost to acquire a customer can often be greater than the initial contract value, low retention can cause an organization to actually lose money when they sign a new customer. It makes the stakes that much higher for delivering a digital experience that keeps users engaged and active in the product over time.
For Talegent’s sales and customer success teams, product data in Pendo offers an important lens into customer health and engagement. Account managers can flag customers with low engagement, start exploring potential causes, and work to solve any issues before the possibility of churn comes into the picture. See how else they’re boosting retention.
7. Time to value
How long does it take for users to find value in the product?
Product usage
Time to value measures the amount of time from when a customer starts using your product to when they start deriving value from it. Many refer to the latter point as the “aha” moment—when a user has a clear grasp of why they need a specific piece of software.
How to measure time to value
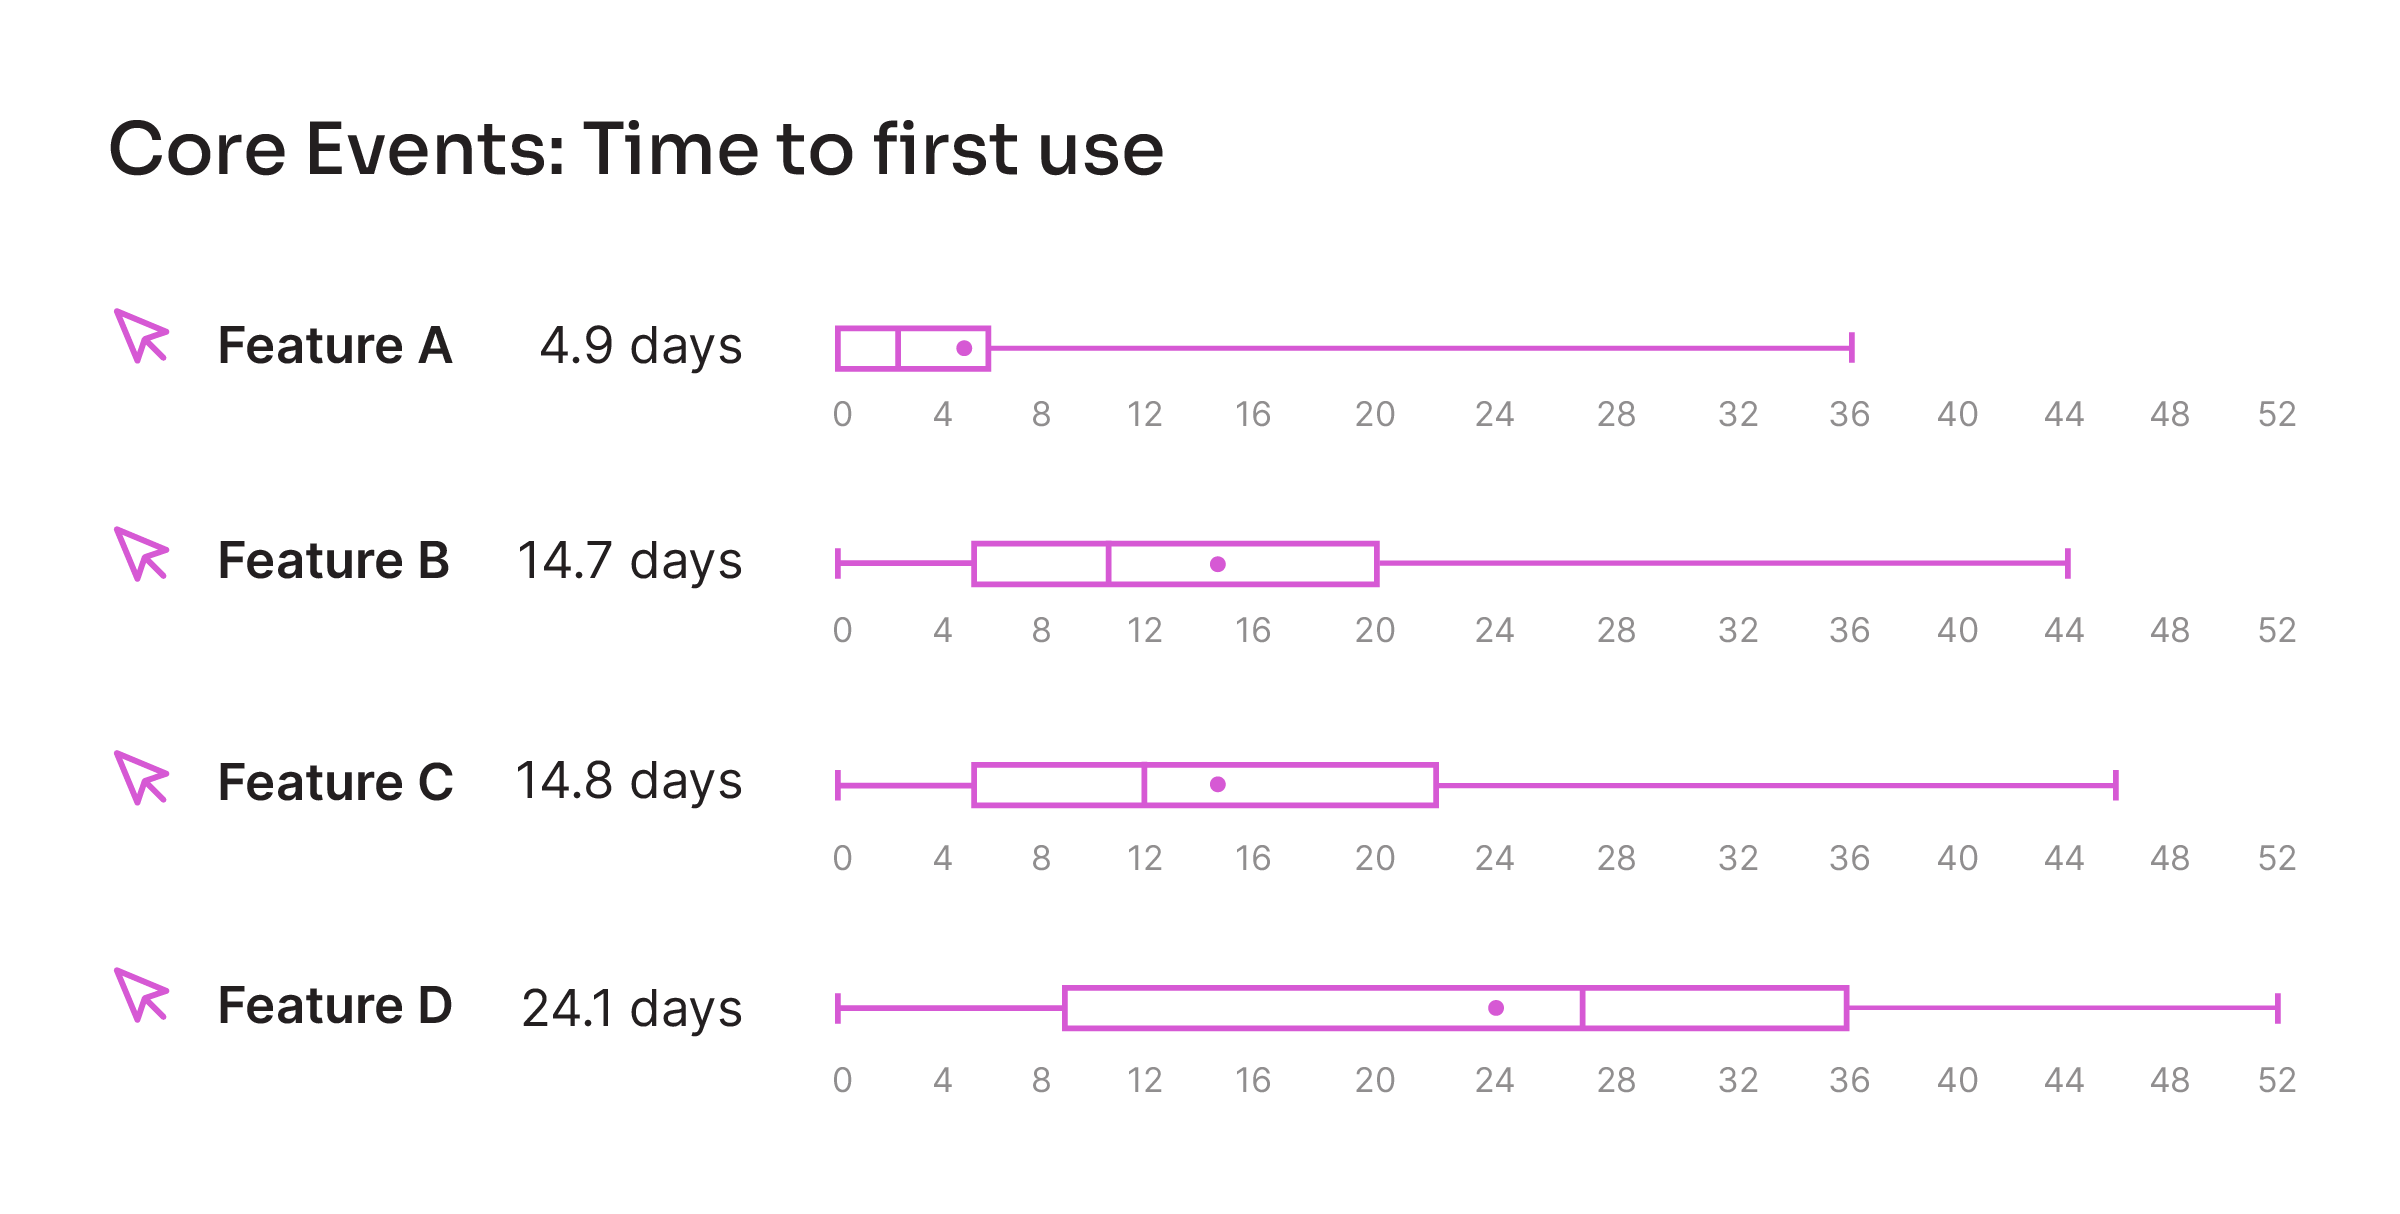
At Pendo, we like to anchor time to value measurement around Core Events, which are the ten (or fewer) key features in a product. In this case, time to value represents how long it takes new users to engage with a Core Event. Ideally, your product analytics tool can tell you the average, minimum, and maximum time it takes new visitors to first interact with a Core Event. Bonus points if you’re able to compare this to the previous time period to see trending changes.
Why time to value matters
No matter how many new features or shiny updates you have on the roadmap, if users don’t feel the benefits of your product right away, they likely won’t stick around long enough to experience those improvements. This puts an added emphasis on a new user’s first impression of your product—they need to understand both how your product works and the value it will bring them.
The UserTesting team used product usage data to understand where users were dropping out of their onboarding flow, and identified a key step that 99% of users were failing to reach (drafting a test). Since they knew engaging with this feature correlated with long-term usage, the team created an in-app onboarding experience that walked users through how to create a test. This led to a 29% increase in users who make it to the “Draft Test” stage and successfully activate the product. Here’s how they did it.
8. Net Promoter Score (NPS)
Are users and customers happy with the product?
Business outcomes
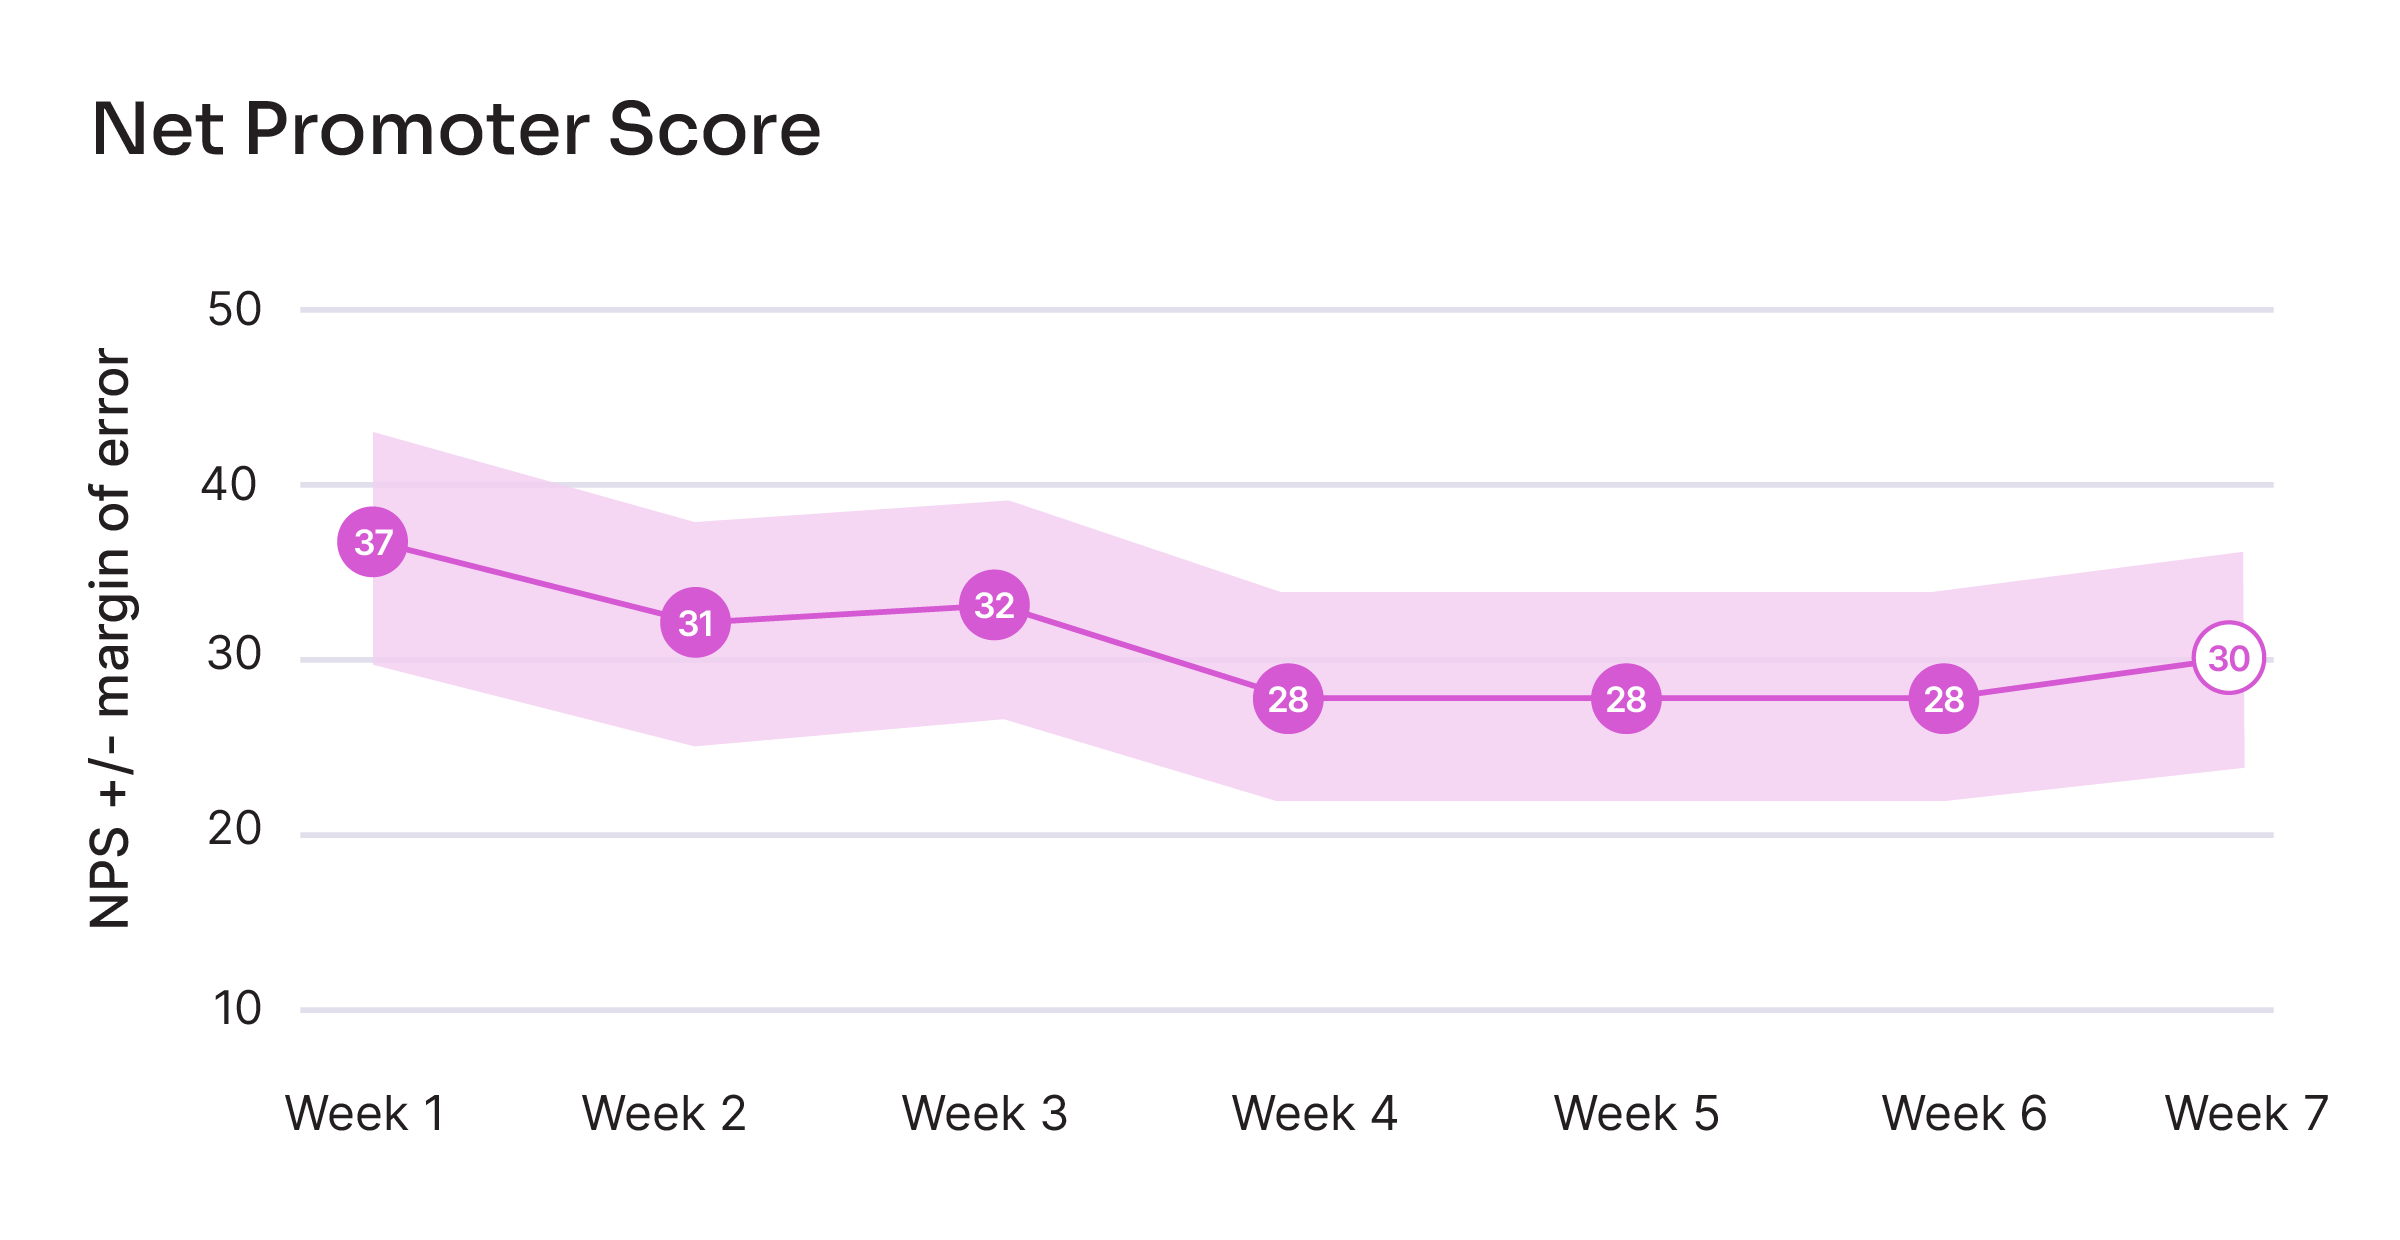
Net Promoter Score (NPS) is one of the most common ways companies gauge customer loyalty. It is delivered via a one-question survey that asks, “How likely is it that you’d recommend this brand to a friend or colleague?” and customers answer on a 0-10 scale. Although some claim NPS to be too simplified, it has remained one of the most pervasive KPIs for customer satisfaction.
How to measure NPS
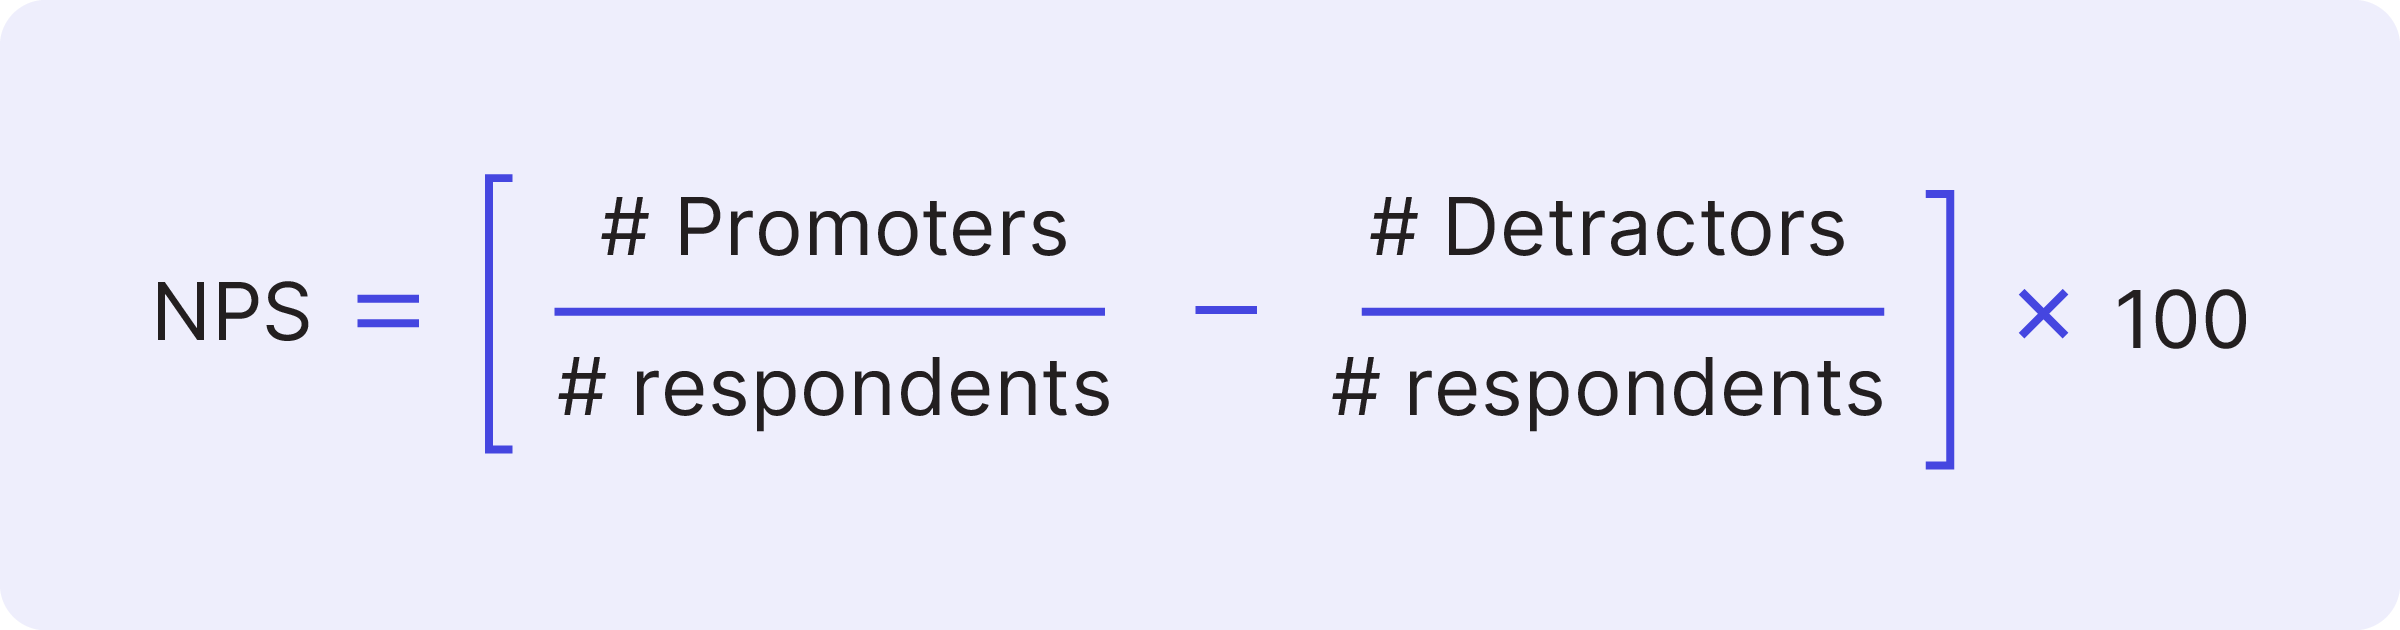
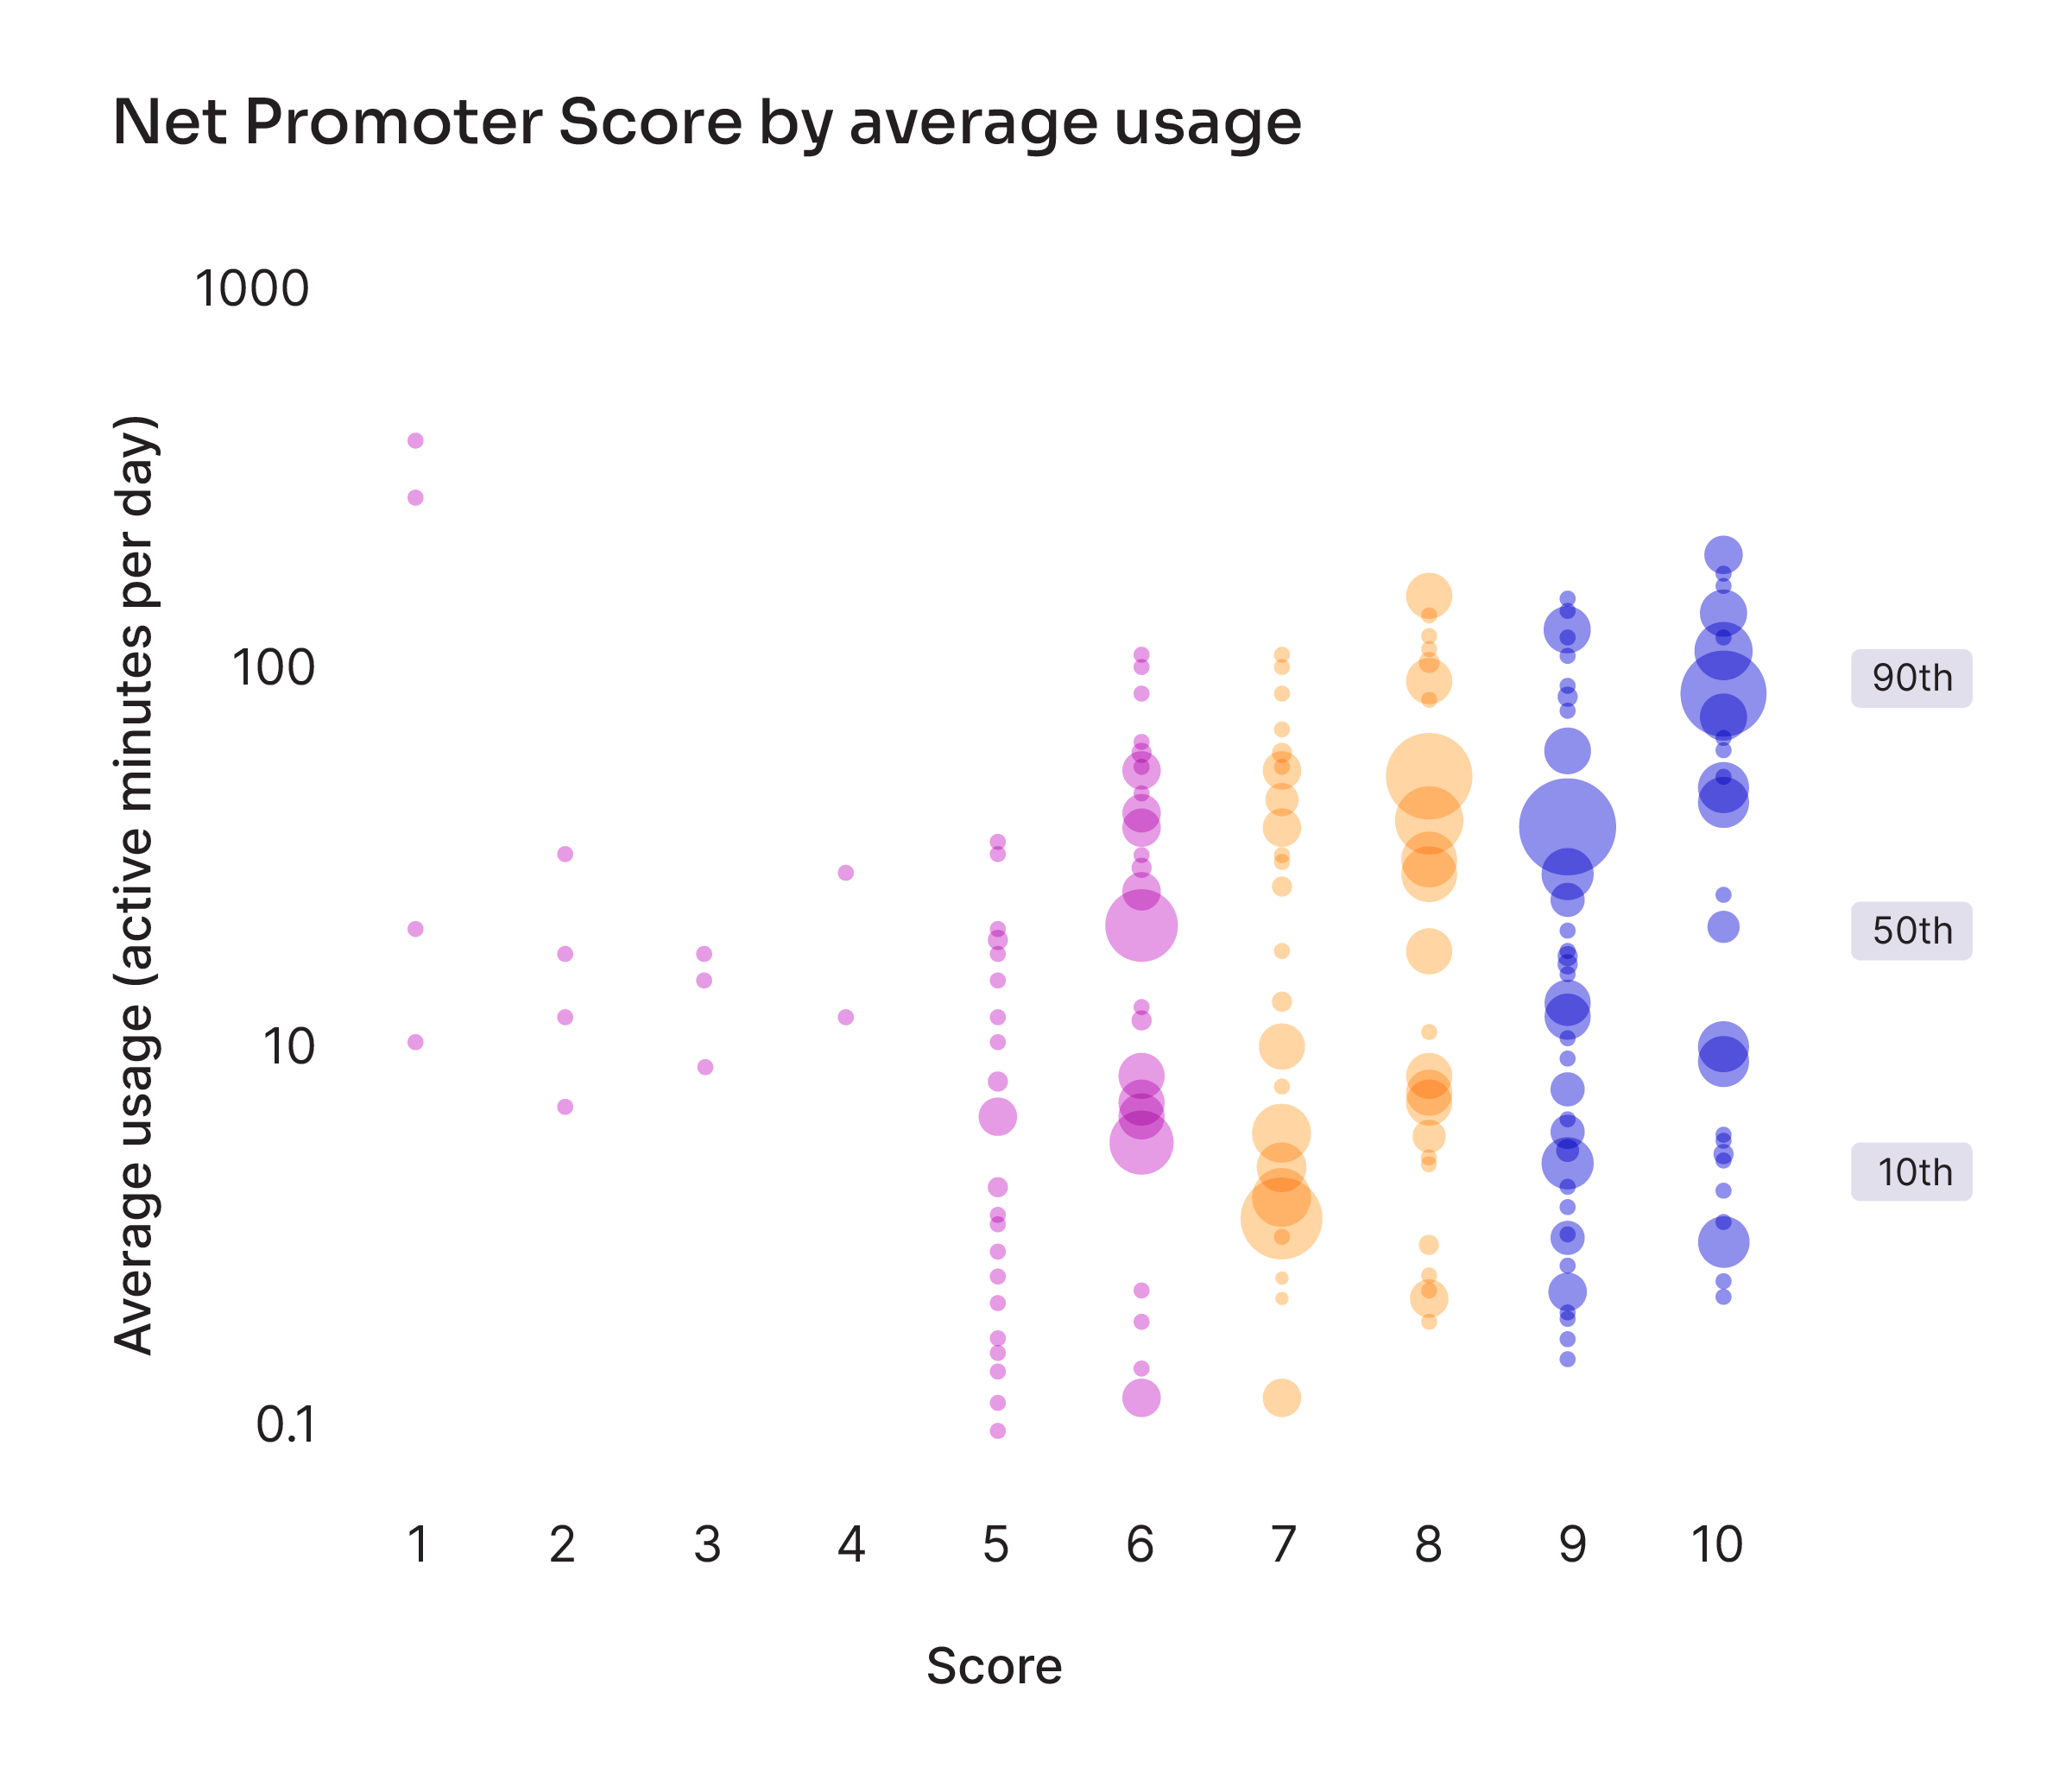
After conducting an NPS survey, mark scores of 9 or 10 as “Promoters,” 7 or 8 as “Passives,” and 0 through 6 as “Detractors.” Then, subtract the percentage of Detractors from the percentage of Promoters to produce your Net Promoter Score.
Here is the formula expressed mathematically:
NPS scores vary greatly by industry, so it’s important to benchmark yourself against those companies that are most similar to yours (if you’re able to find the data). More important is to benchmark yourself against yourself—track NPS over time and look for any changes, especially as they coincide with business events like product updates and marketing campaigns.
Remember to measure NPS at the account and visitor level. Account-level scores will help you understand your average sentiment, whereas user NPS helps uncover if there are any key personas driving your score up or down. Be sure to also include a section in your survey where users can provide written comments, as this information adds valuable context to numerical scores.
Why NPS matters
Net Promoter Score has implications beyond current customer sentiment. Customers’ propensity to advocate for your brand serves as a proxy for customer happiness and, eventually, business growth. As you measure NPS you’ll likely be focused on improving your score in the short term, but it’s equally important to remember the long-term implications of a strong NPS.
After identifying a common theme about their auto-logout security feature, Patientco’s marketing manager took this feedback from an NPS survey and got to work. First, she deployed an in-app guide to users who reported displeasure with the feature to let them know their feedback was heard. Then, she took the feedback to the product and development teams and came up with a technical solution: adding a notification that warned users they were about to be logged out. The result? A 16-point increase in NPS over a six month period. Learn more about their NPS strategy.
9. Top feature requests
What do users want from the product?
Business outcomes
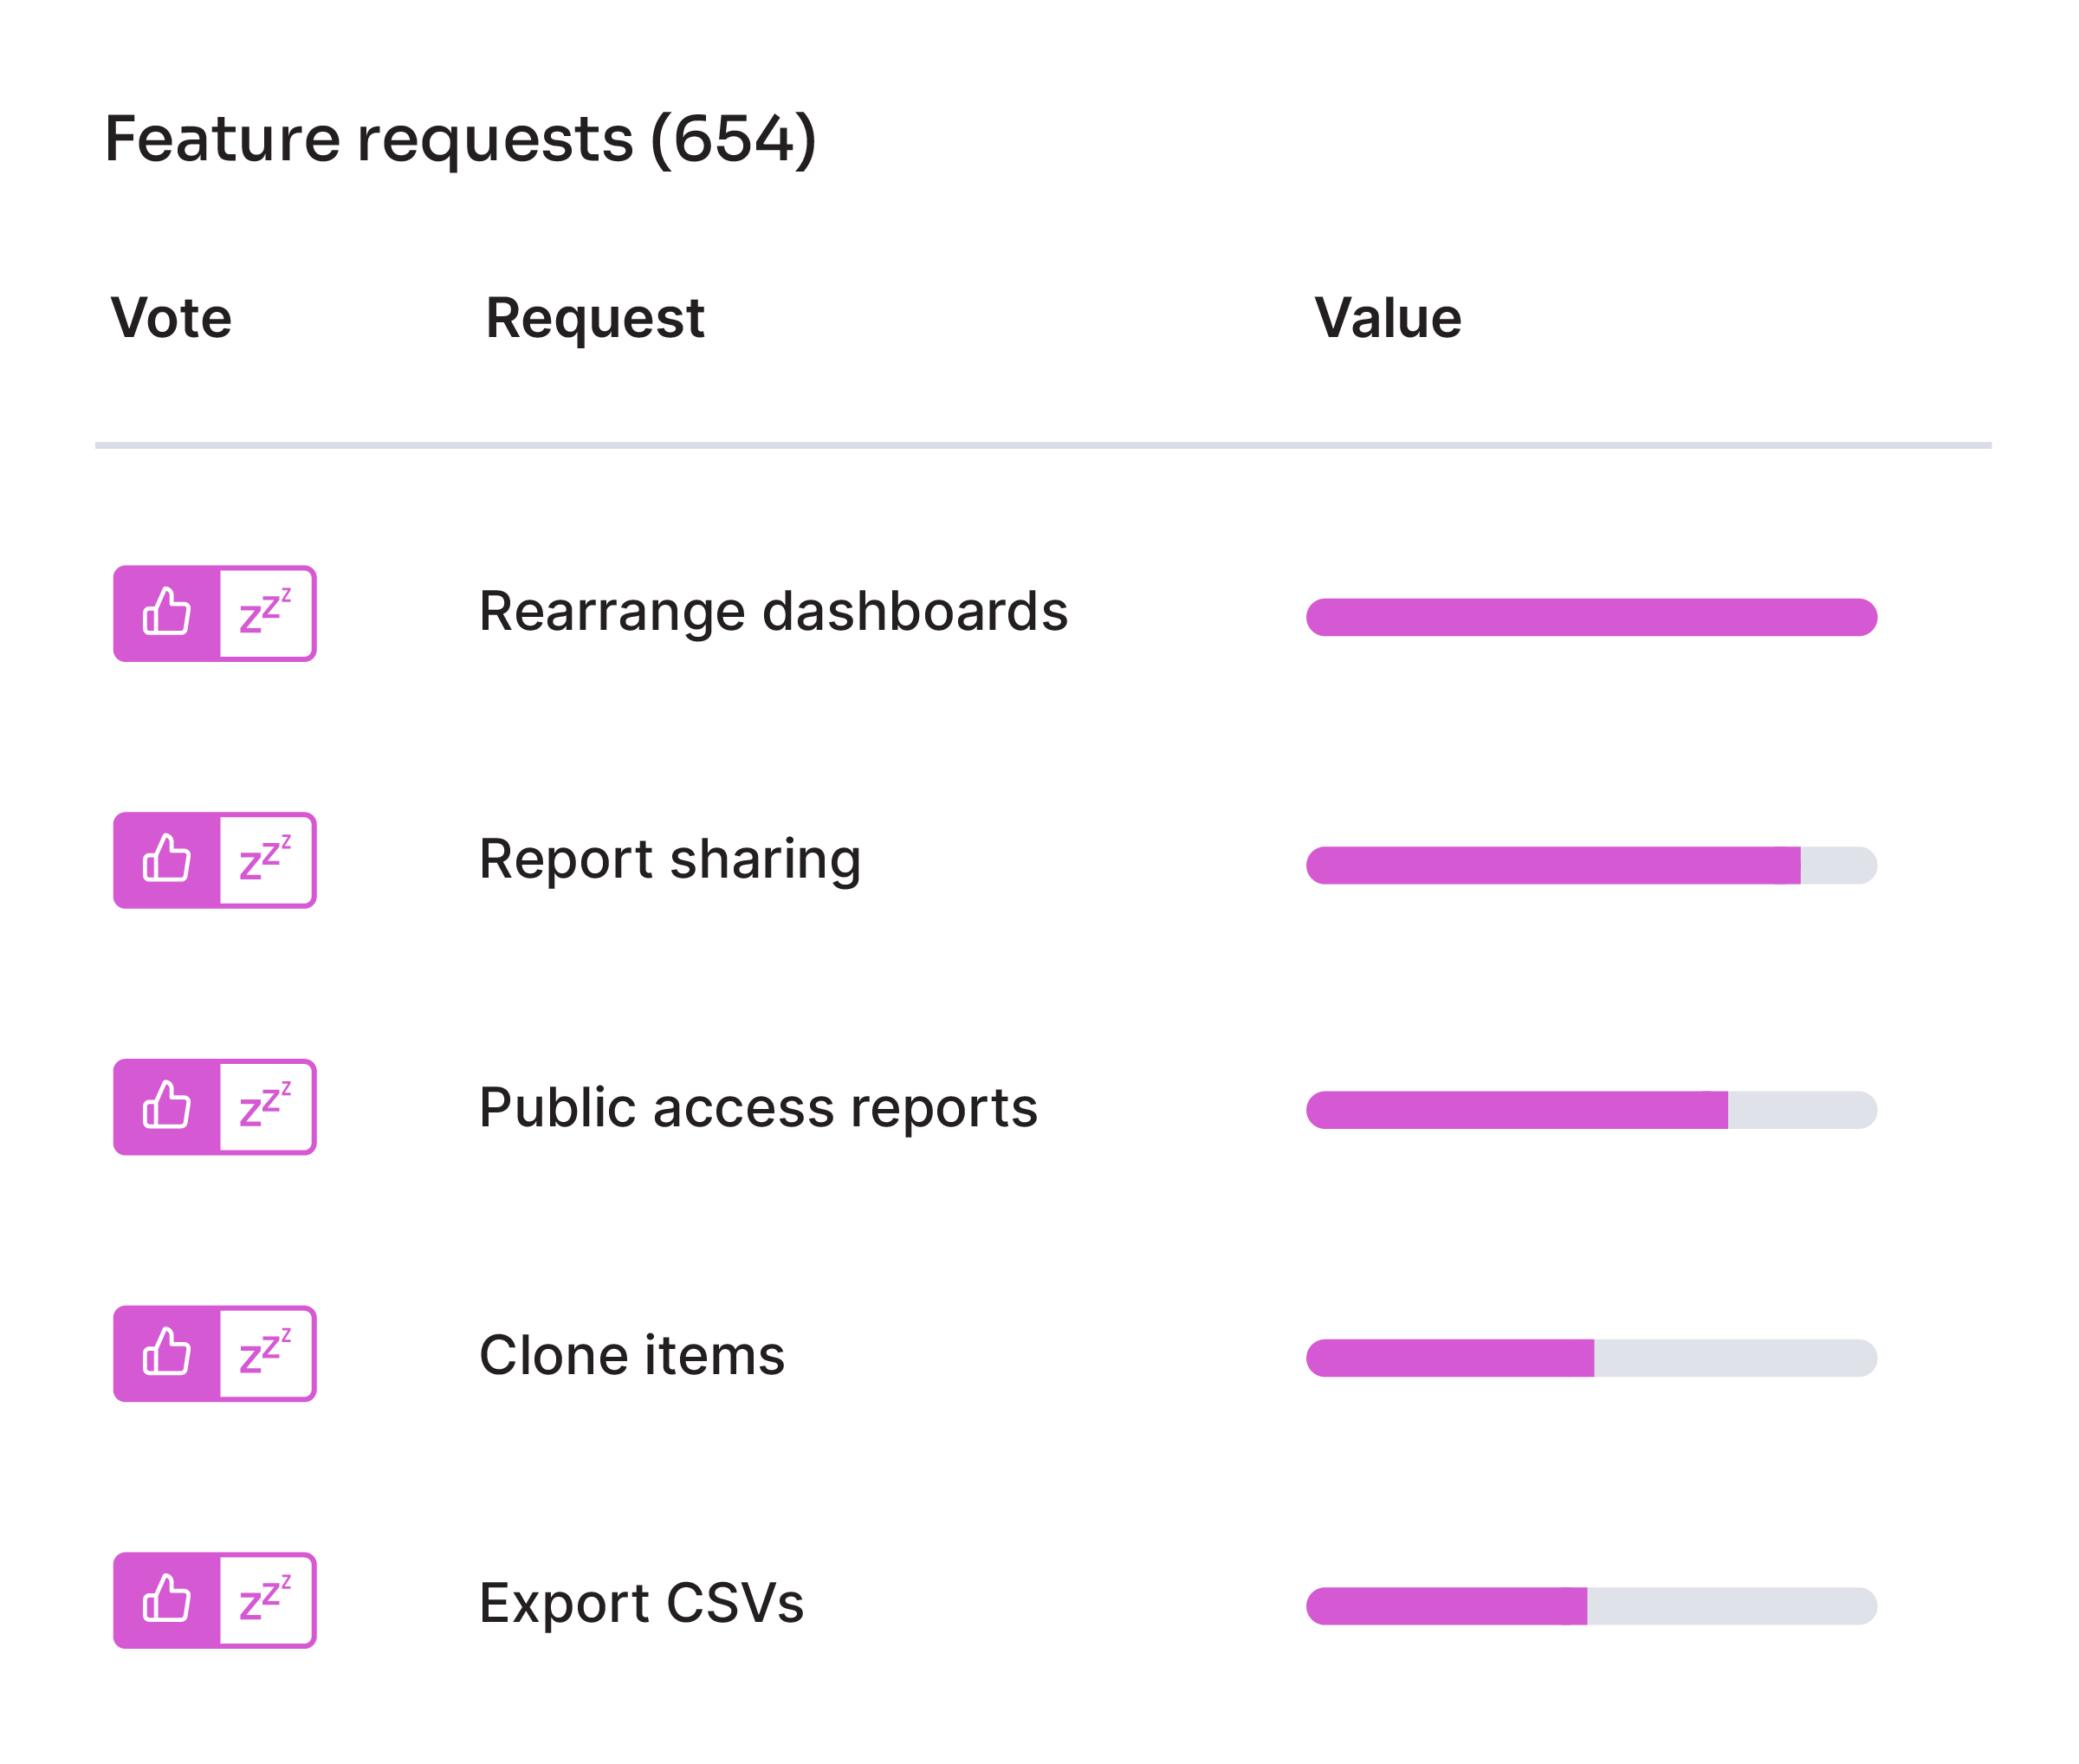
The idea of knowing which features your users are requesting is pretty straightforward, but the tricky part is figuring out which requests are the most important. In this case, “top” can mean features that are requested most often, or requests that are tied to customer accounts with the highest ARR, and therefore have the highest business impact potential.
How to measure top feature requests
As a product leader, you’re probably familiar with feature requests coming at you from all angles—one-off conversations with customers, your own sales team, user interviews, in-app surveys, social media, support tickets. The list goes on.
The biggest challenge is making sense of all these requests so you can identify common themes and determine your users’ most pressing needs. This first requires you to establish a centralized place where all feedback lives, ideally in a system that is easy to update and organize and that everyone at your company can access. From there, you can view feature requests as a whole to understand which requests (or types of requests) appear most often, and better prioritize your team’s work.
It’s also useful to analyze feature requests at the user and account level, and segment by things like company size, ARR, industry, NPS response, or subscription type (if you have a free and paid version of your product). The way you choose to segment and analyze requests will depend on your business’ goals. For example if you’re trying to go after a new persona, you’ll want to look at requests from those users specifically to see if there are any patterns. To help prevent churn from your biggest customers, it’s useful to analyze top requests by account to see if there are improvements worth investing in.
Okta’s customer first programs team wanted to ensure there was a single channel for input and output of customer feedback, and a clear way to prioritize requests. They leveraged Pendo Feedback as their tool of choice, allowing users to submit requests directly and the Okta team to easily prioritize based on popularity, revenue impact, and other key parameters. Since implementation, customers have submitted 440 new ideas—a 57% quarter over quarter increase. See their story.
Why feature requests matter
Although this guide has mainly focused on using quantitative data to make better product decisions, qualitative data is equally valuable. Customer feedback and feature requests provide important context—product usage data tells you what users are doing, but feature requests help explain why they’re doing it. And the best product decisions are informed by both.
Still, you can’t just listen to the loudest customer. Teams need a way to prioritize all their incoming requests and view them holistically to understand themes and potential gaps in the product. Bringing the voice of the customer into your planning process will only make your product better, especially when combined with the product usage data you’re already collecting.
10. Product performance
Is the product performing efficiently and without bugs?
Product quality
Whether at work or in their personal life, software users expect products to work, and do so at optimal speeds. For the purposes of this guide, product performance refers to the speed at which it can return requests, downtime vs. uptime, and the number of bugs. Taken together, these measures will help your team stay focused on not only building a product that delights users, but one that doesn’t let them down.
How to measure product performance
One of the key ways to measure product performance is through product response time (which measures the time taken by the product’s system to respond to any request). In order to instill this as a priority for your team, we recommend setting an internal performance benchmark and measuring yourself against it monthly or quarterly. For example, you might set the standard as requests delivered in five seconds or less, and hold yourself accountable to maintaining that standard for a sizable portion of your customer base or a sizable percentage of all requests.
You should also monitor your downtime and uptime metrics on a weekly, monthly, or quarterly basis (or a combination of the three).
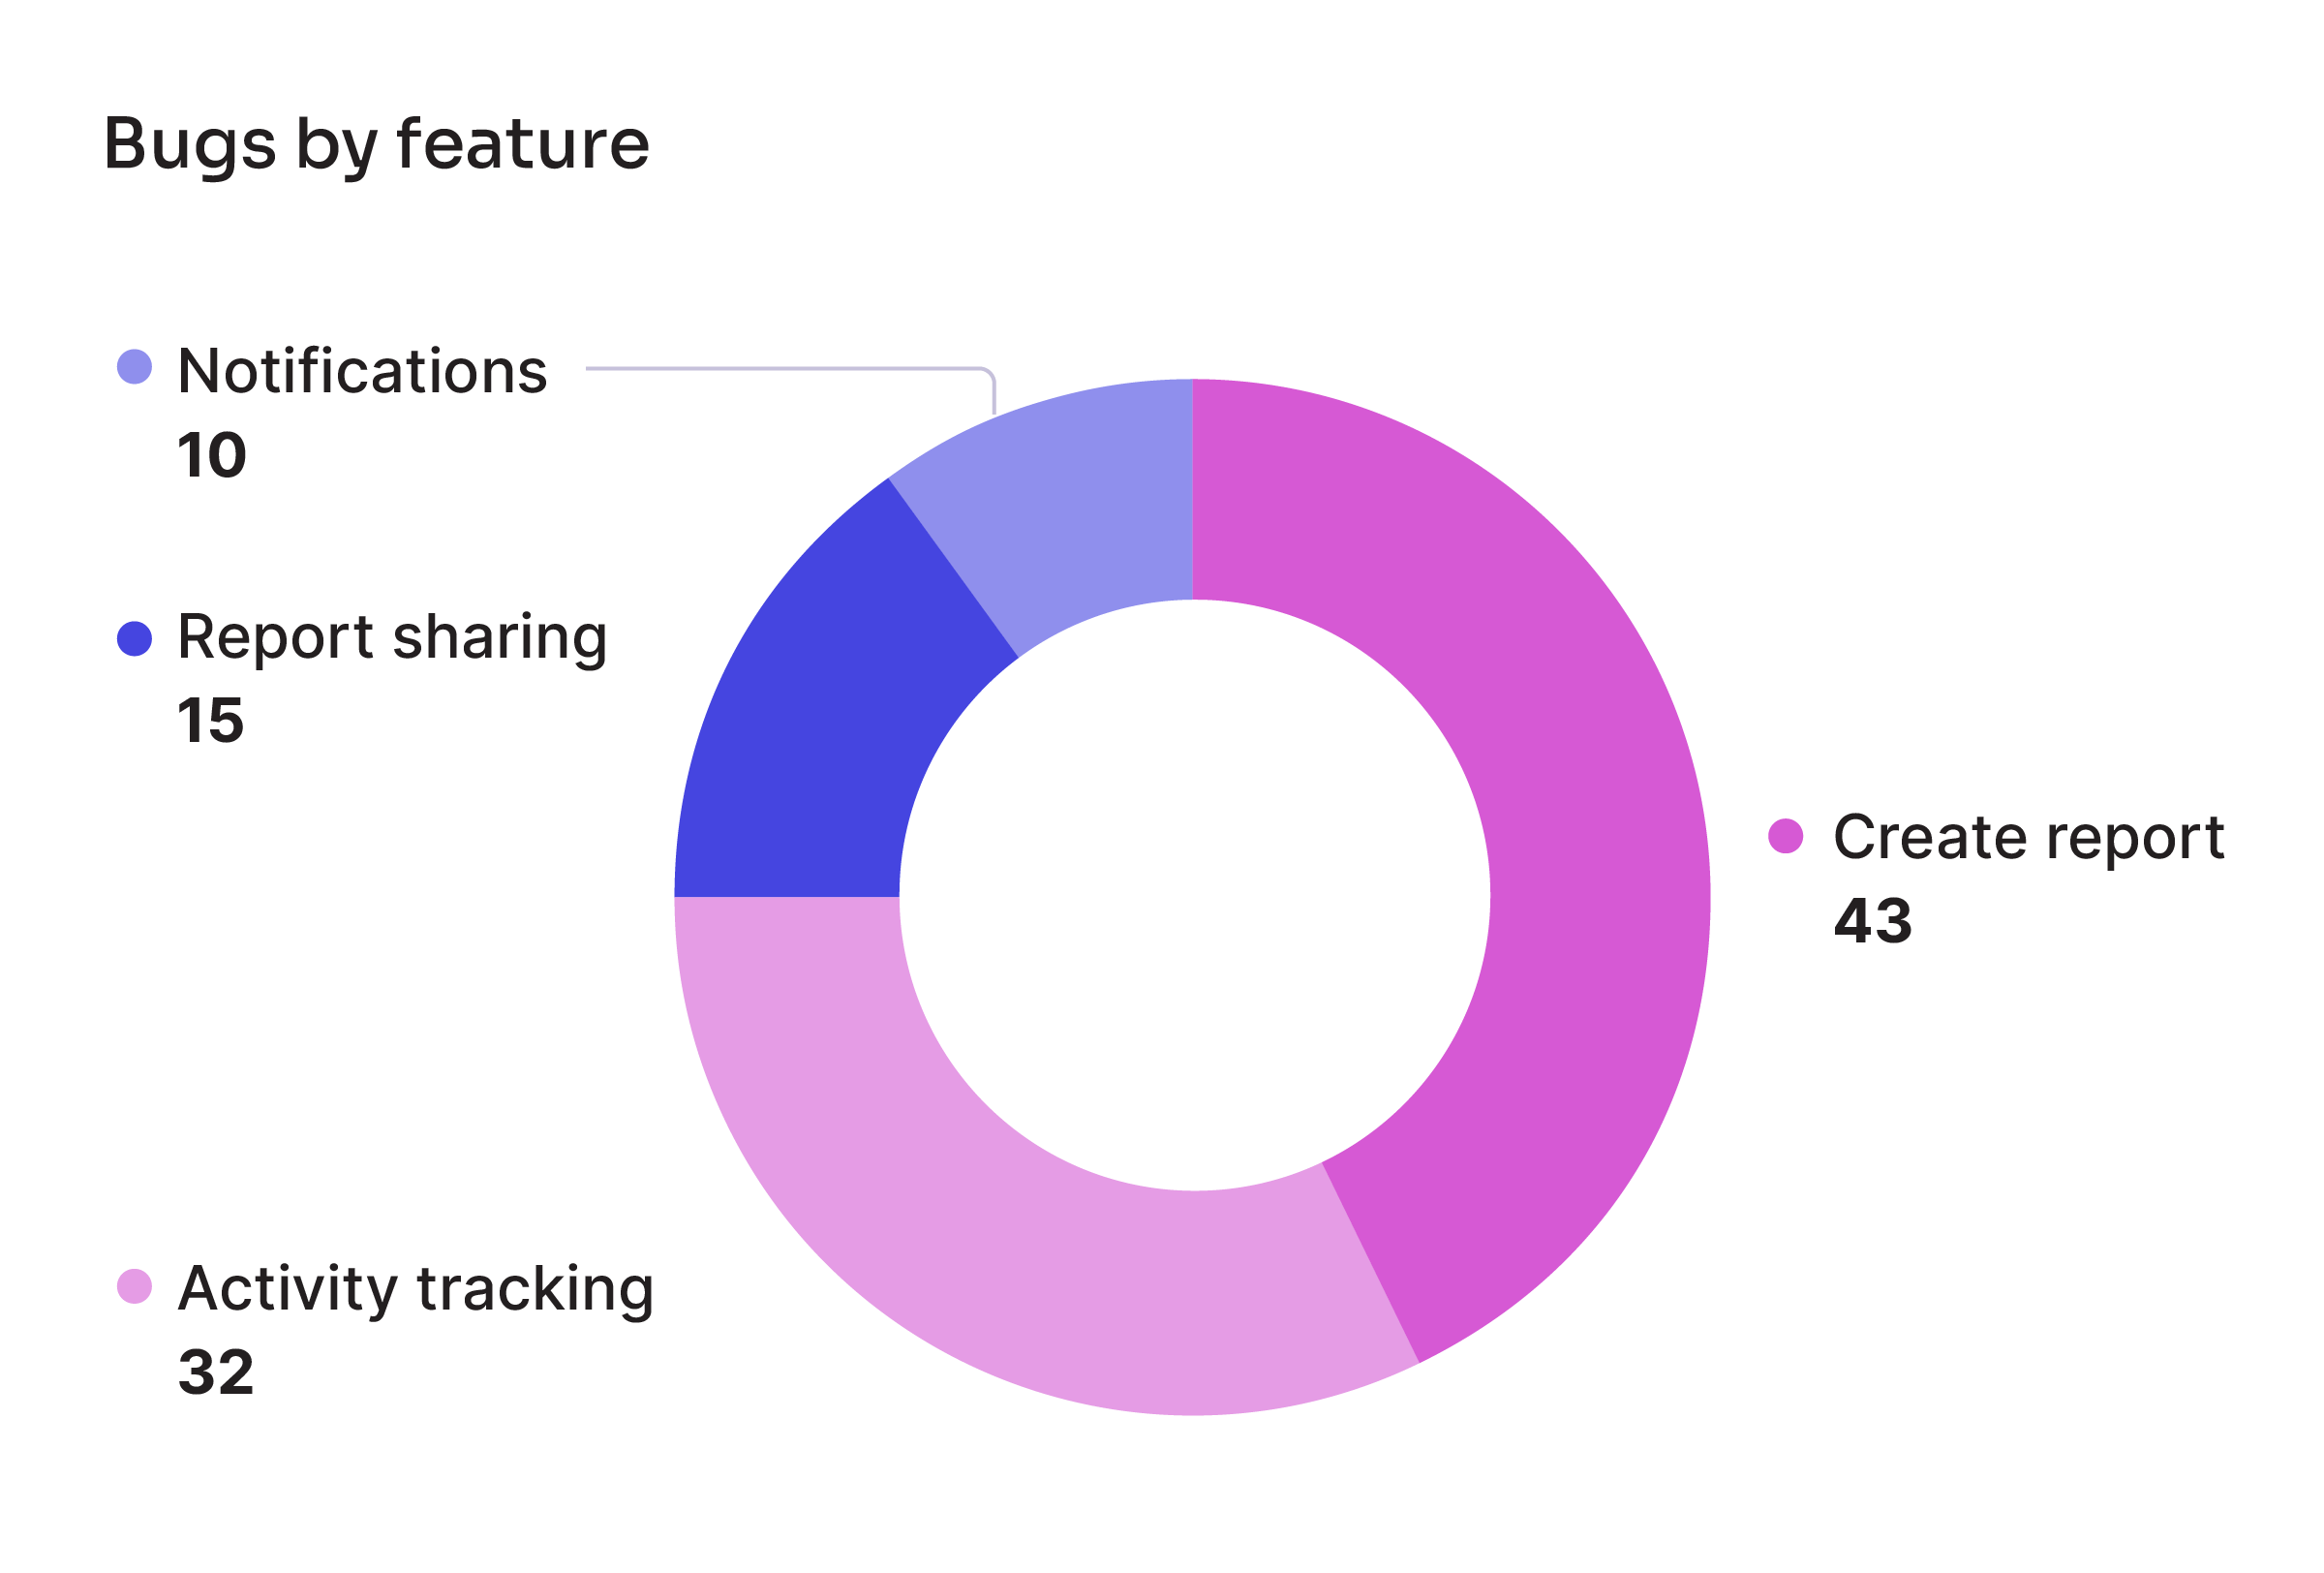
When it comes to product bugs, there are a few measurement tactics to keep in mind:
- Track the breakdown of product bugs by feature
- Map bugs to product usage and prioritize fixing those that are in the most heavily used areas of your product
- Measure the number of bugs reported vs. the number of bugs you’ve fixed, and track it over time to evaluate how well you’re maintaining your product’s quality and efficiency
Why product performance matters
There’s no denying that users perceive those products that operate quickly and with as few glitches as possible to be the best. While it might be more interesting to track data points like stickiness or retention, you can’t ignore product performance, or assume everything is fine (cue the meme). Product leaders need to stay on top of these metrics, and ensure their entire team understands the importance, too.
After all, a working product is table stakes and an outage or consistent, pesky bug can severely impact your customers’ experience and their perception of your business as a whole. Not to mention it’s never been easier to switch software providers. Especially in SaaS, users are always just one renewal cycle away from going with a competitor who can deliver a similar experience, but faster.
As a product leader, the last time you heard (or said) something along the lines of, “What does the data say?” was probably in the last day—or hour. While operating with a data-first mindset is valuable, it’s even more valuable when you know you’re measuring the right things. We hope this guide helped shed light on the essential metrics that every product team needs to keep top of mind. These ten KPIs will help you unlock the fun part: using data to make better decisions and build a better product for your users.