Table of Contents
In a rush?
Download the PDF for later
Product onboarding plays a critical role in guiding users to value within your application. Once implemented, though, how can you measure the impact of onboarding on a particular user’s behavior and ultimate success?
While many teams measure the success of onboarding through analyzing guide views or completion, these metrics alone tell only part of the story. Pendo allows users to get a more complete sense of what’s working in your onboarding experience and what’s not. Recommended metrics can be broken down into three specific categories:
Onboarding engagement. These metrics measure user engagement with the onboarding content itself. While these should not be the only metrics you analyze, they can provide a basis from which to start analyzing the data in the other categories
Product usage. This category of report looks at how an onboarding guide actually changed users’ behavior in your product.
Business outcomes. Measurements at this level give you a general sense of how onboarding influences your most important KPIs.
In taking this approach to onboarding measurement, you can ensure you’re delivering onboarding experiences that have real impact on your most important product metrics.
Engagement with onboarding content
Onboarding engagement
Each guide in Pendo has a series of reports associated with the guide. The reports highlight the following components:
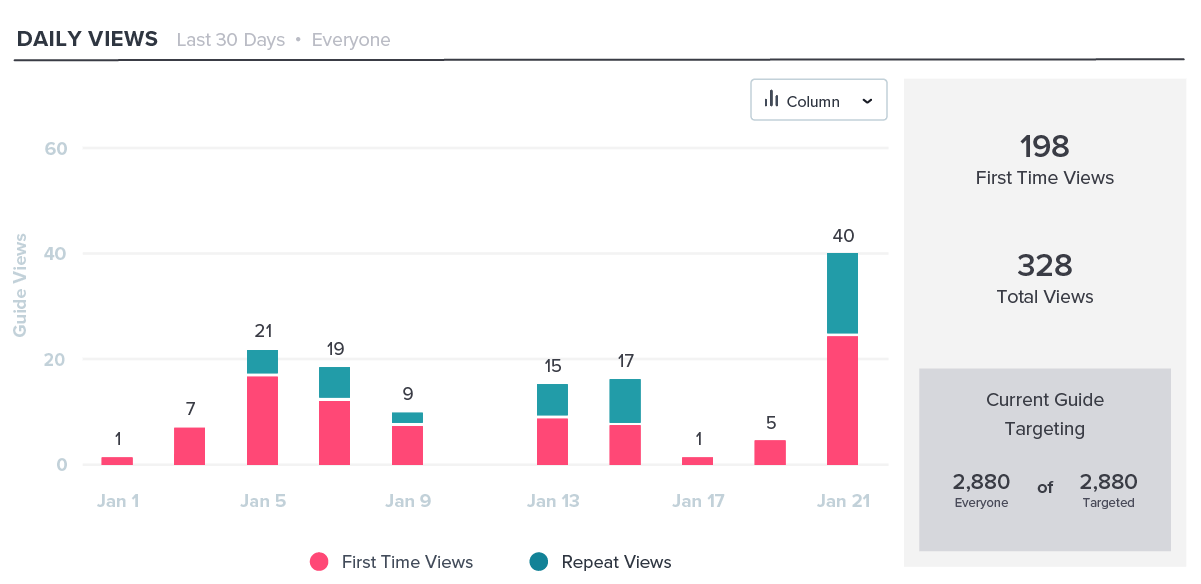
Guide views
You can first see an overview of how many people viewed the guide versus how many people were targeted with the guide. This report can easily visualize whether a particular guide achieved the reach you anticipated.
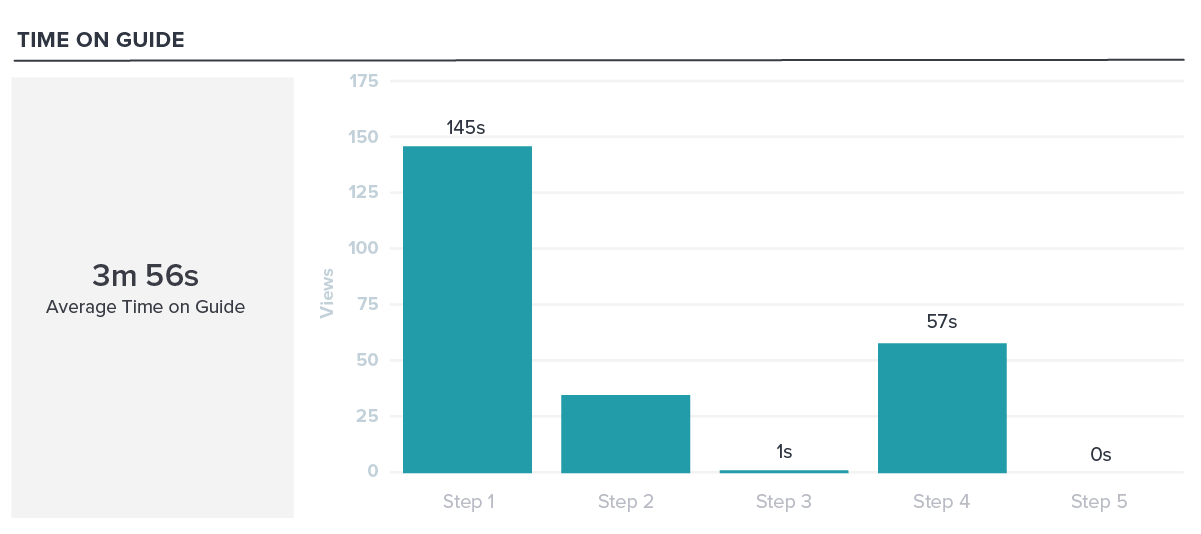
Guide step completion and time in guide
As you scroll down the guide analytics dashboard in Pendo, you will also see guide-step-completion and time-in-guide reports. Both of these reports can be a reliable indicator of guide engagement and whether users are seeing value in the content.
As you begin to implement onboarding walkthroughs in your product, you can use this report to validate the optimal guide length for your users.
PRO TIP
In studying Pendo data, guides between two and four steps in length had completion rates of nearly 50%. Guides with up to eight steps had completion rates of 45% on average. The shorter, the better.
Individual visitor data
Finally, if you’re looking for a more detailed view of how certain users or accounts interact with a guide, you can get a more detailed view by visitor to better understand when someone accessed a guide, how far they progressed, and what their ultimate action was.
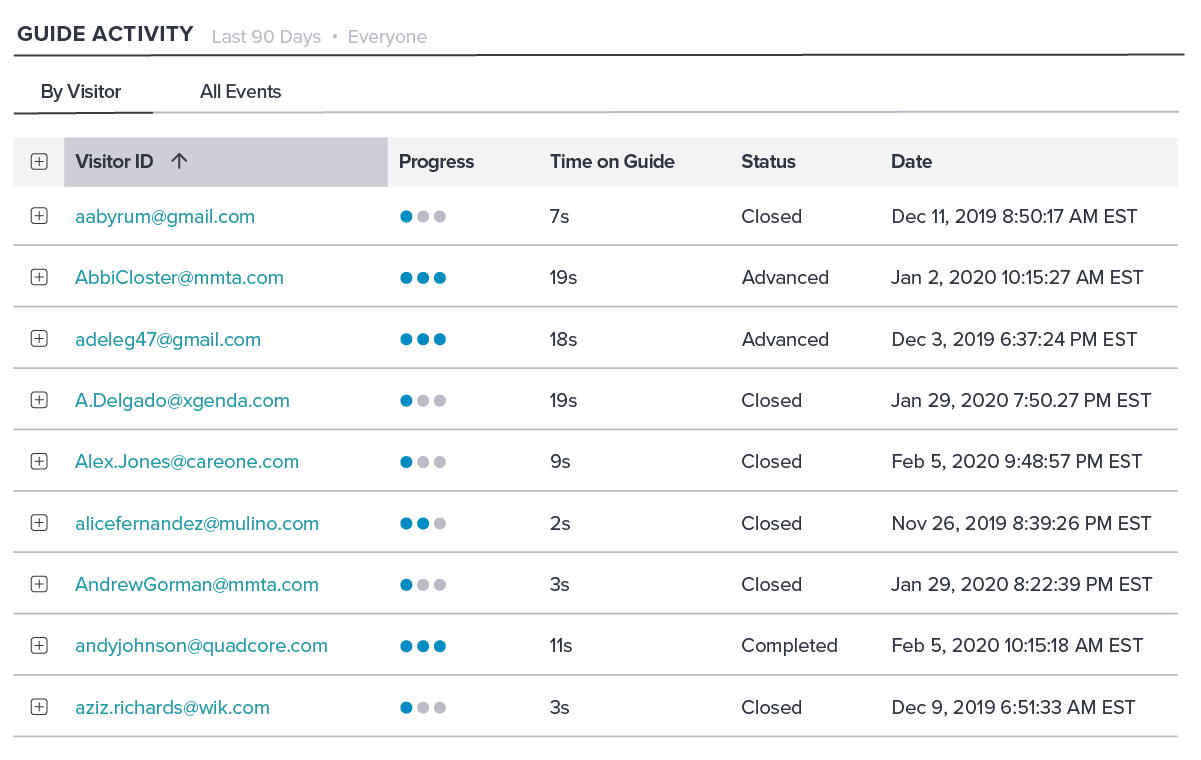
This granularity of data can be helpful for customer-facing teams to identify which accounts or users may need additional support. This list can also be exported to help track compliance in the event the onboarding experience has required components (for example, this could be particularly relevant if the end users are employees).
Impact on product usage
Product Usage
While understanding onboarding guide engagement is important, it’s perhaps even more essential to know whether a guide influenced the desired product behavior.
CUSTOMER QUOTE
![]()
“Pendo analytics gives us the ability to objectively measure user behavior and performance. Measuring and predicting product adoption are necessary to identify overall customer health and anticipate additional support.” – Adam Siegel, CareCloud
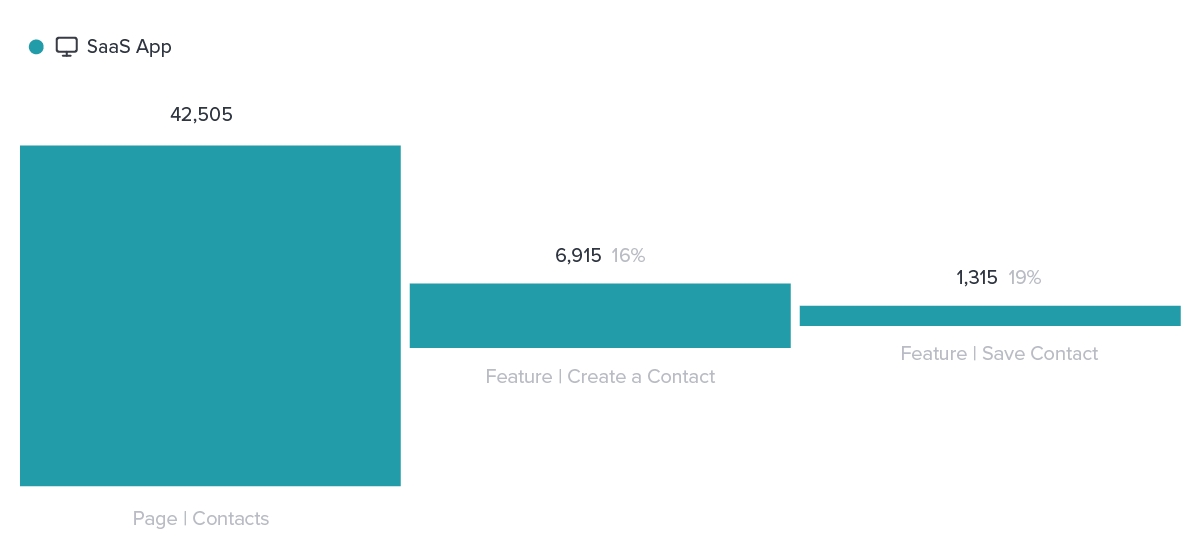
Data Explorer
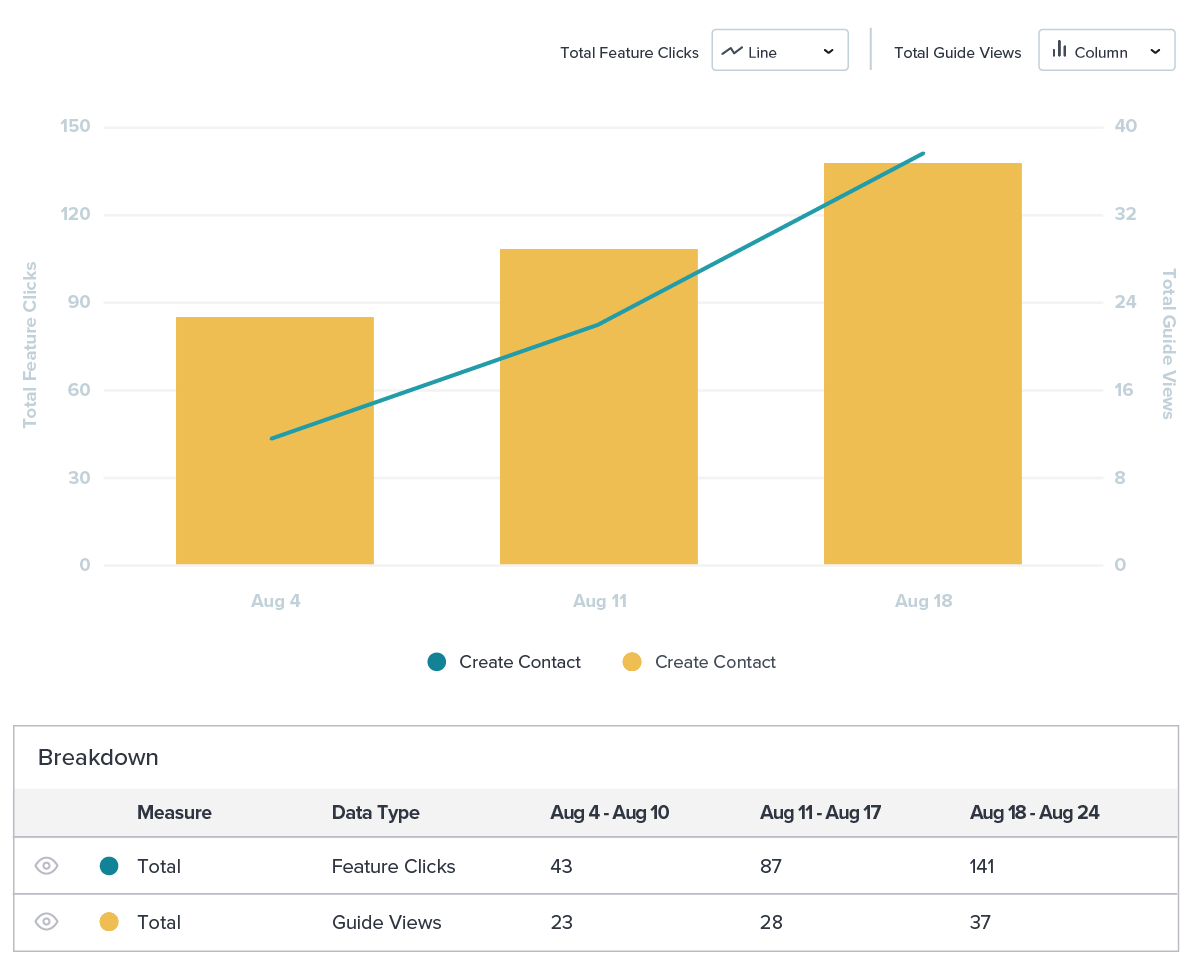
Pendo’s Data Explorer feature makes it easy to understand how guides are influencing feature clicks, page views, and track event completion.
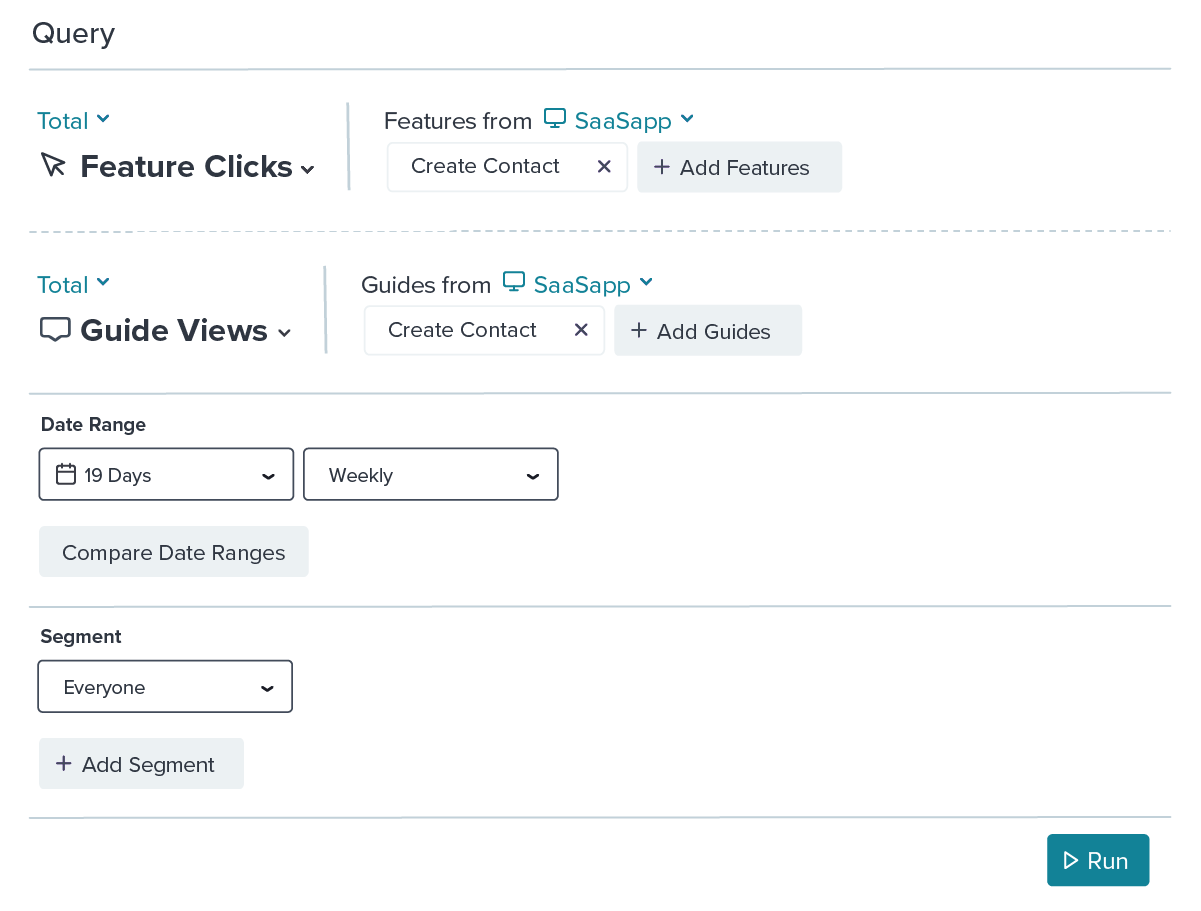
You can easily run a query to see how a guide influenced usage of a particular feature. Do this by selecting the appropriate feature and guide in data explorer and apply the date range you’d like to analyze.
Run the query and analyze the results to see what impact guide engagement had on feature adoption and user behavior.
PRO TIP
Alter the type of chart and its axes using the customizable dropdowns in the graph.
Onboarding Funnels
Another easy way to visualize guide impact on product usage is to analyze the funnels associated with each of the guides you’ve built. Funnels are analytics tools that allow you to measure how customers move through a defined series of steps. They can provide a high level of clarity as to where your customers drop-off when following these steps.
If you have a three-step guide, for example, you can build a funnel mirroring the navigation steps you’re asking users to take within the guide. To have a more precise lens into onboarding effectiveness, you should apply a segment that filters for users who have engaged with the guide you’re trying to measure.
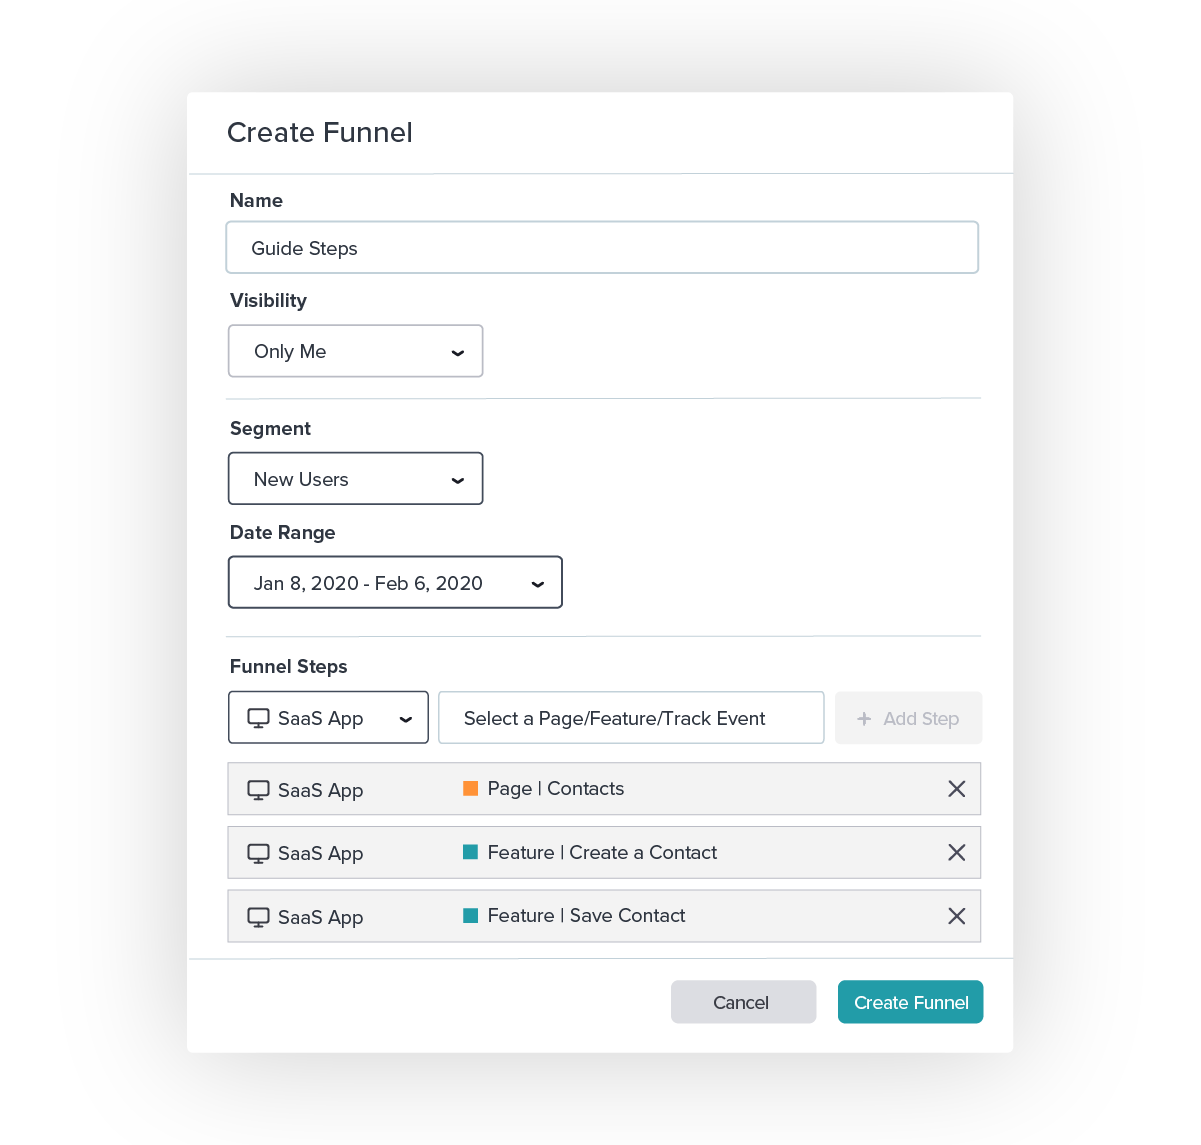
Once you generate the funnel, you can easily see where users are departing from completing the task outlined in the onboarding guides you’ve created to help inform improvements.

Impact on business outcomes
Business Outcomes
Driving onboarding engagement and product usage through in-app guides should all be in service of driving broader critical business outcomes, such as customer retention, stickiness, and satisfaction. Measuring these metrics in the context of a specific onboarding experience can help provide a general view of how onboarding may be impacting your most important KPIs.
Prior to analyzing specific metrics, you should first create a user segment filtering users who have viewed the particular onboarding guide you’re looking to measure.
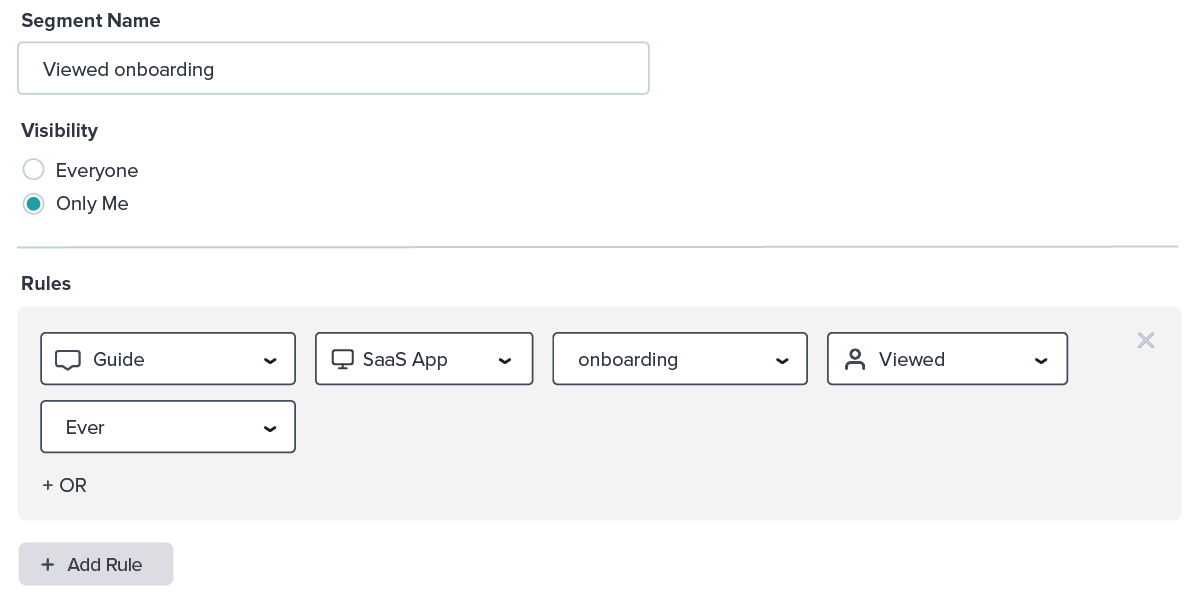
You will use this segment in other Pendo pages to better isolate and understand the direct impact of a particular guide.
Retention
Pendo’s retention page provides a cohort analysis of the percentage of users that continue to return to the app over time. In addition to viewing high-level trends, you can apply your guide viewers segment to better understand what impact this particular onboarding flow had on a certain cohort’s retention rate.
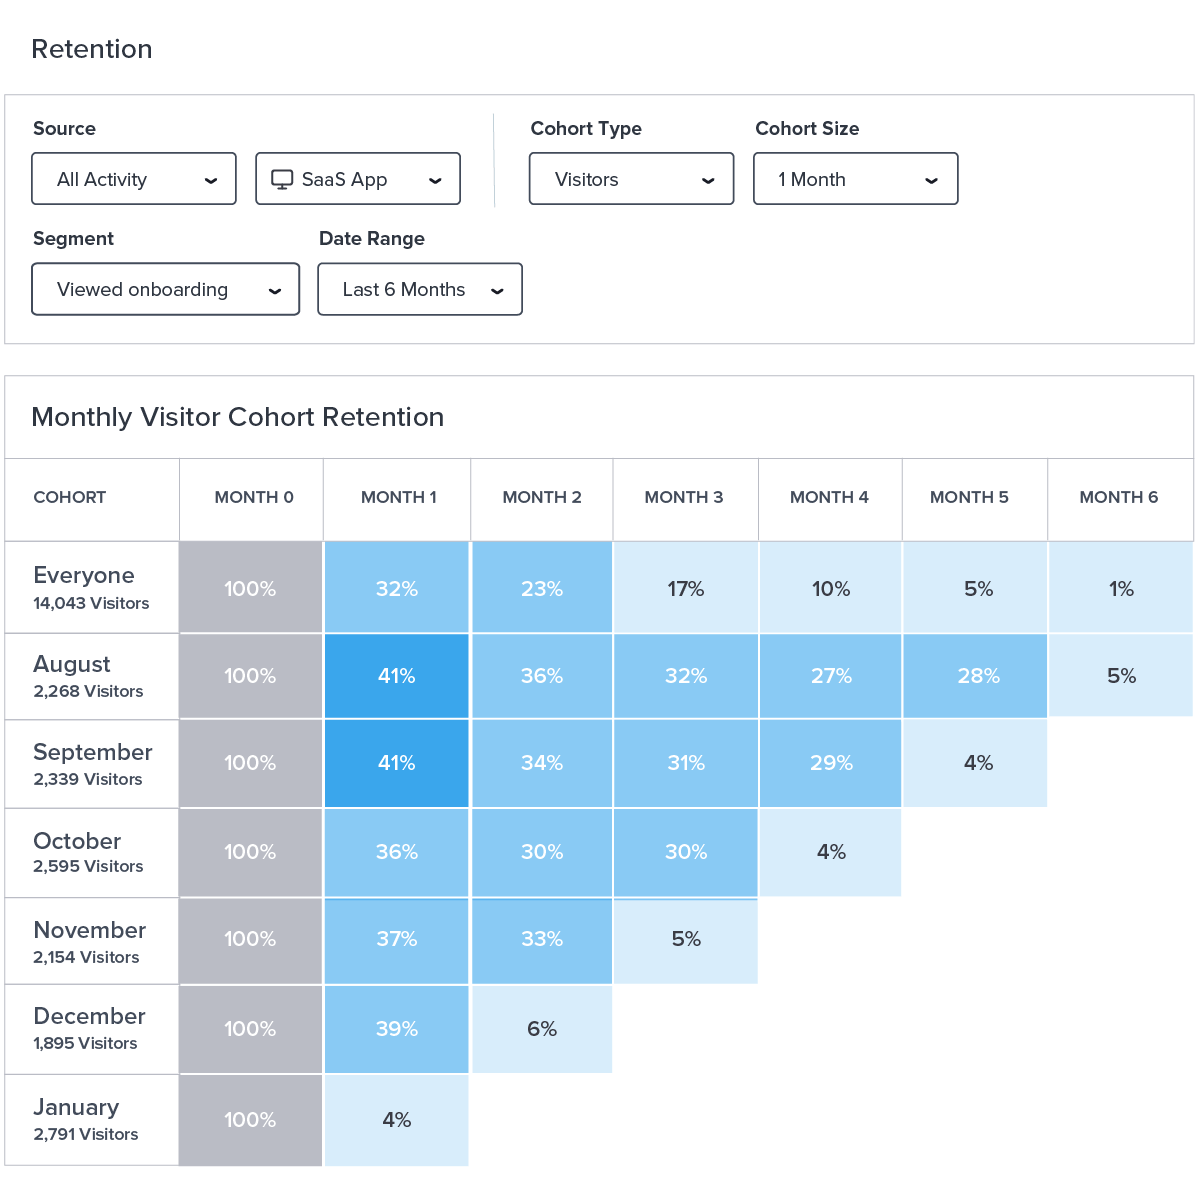
You can look at retention by visitor or by account depending on what will be most impactful for your business.
PRO TIP
You can leverage Pendo’s interactive benchmark tool to help set targets for overall app retention and understand how you’re performing in relation to your peers.
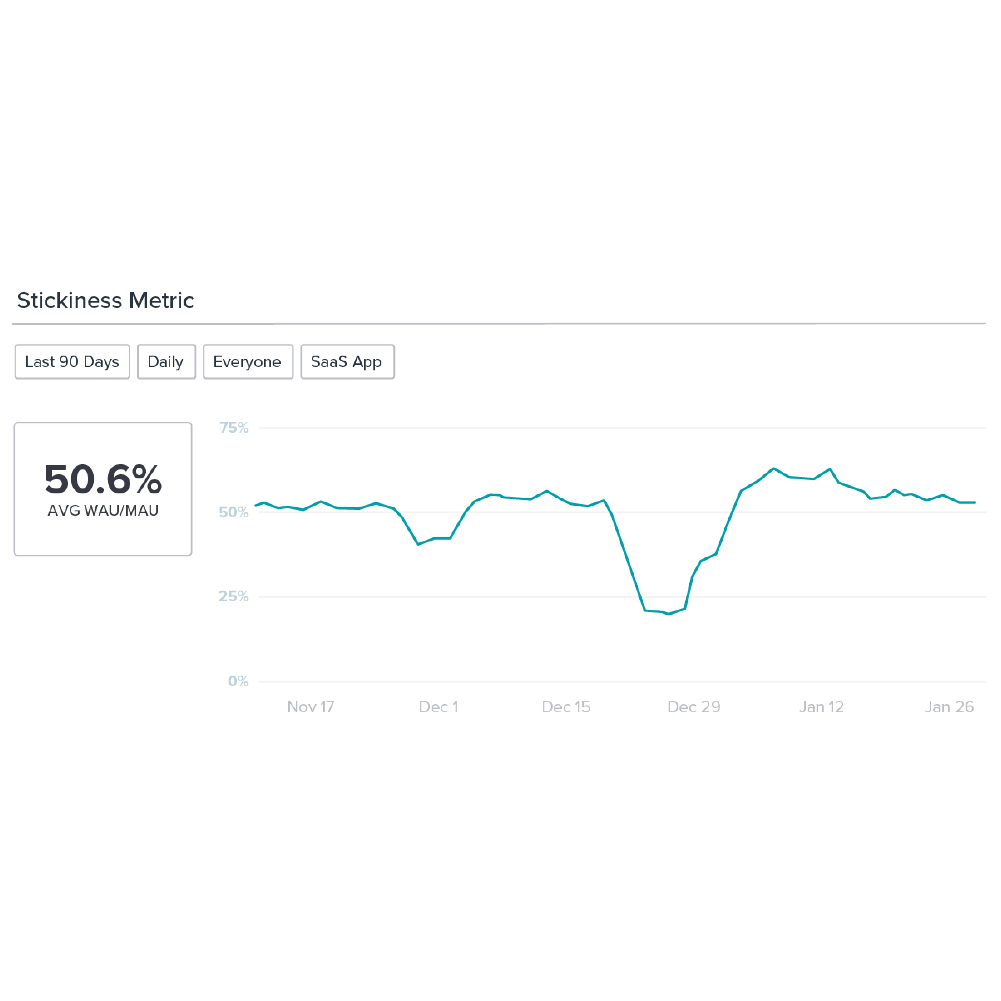
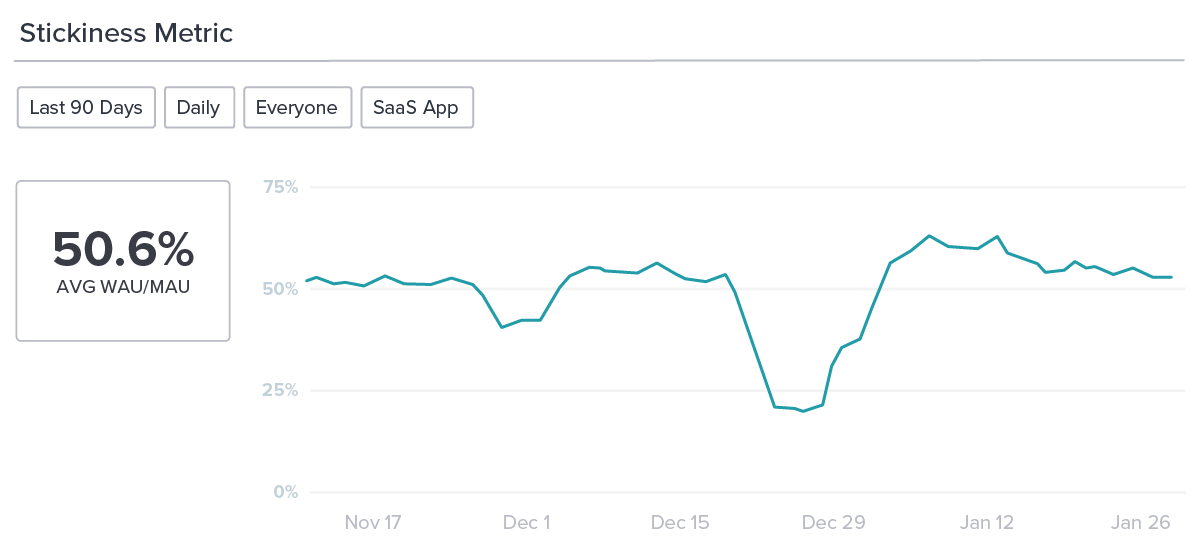
Stickiness
Stickiness is a product engagement metric that measures how many users return on a regular basis. Pendo allows you to measure stickiness in two ways: the percentage of users who return daily, and the percentage of users who return weekly.
Pendo’s Stickiness widget allows you to track stickiness over time. Benchmark product stickiness prior to implementing onboarding and after implementing onboarding to help understand the long-term impact onboarding has on overall product engagement:
PRO TIP
Apply a segment to see the stickiness for users who viewed your onboarding walkthrough versus users who didn’t.
NPS
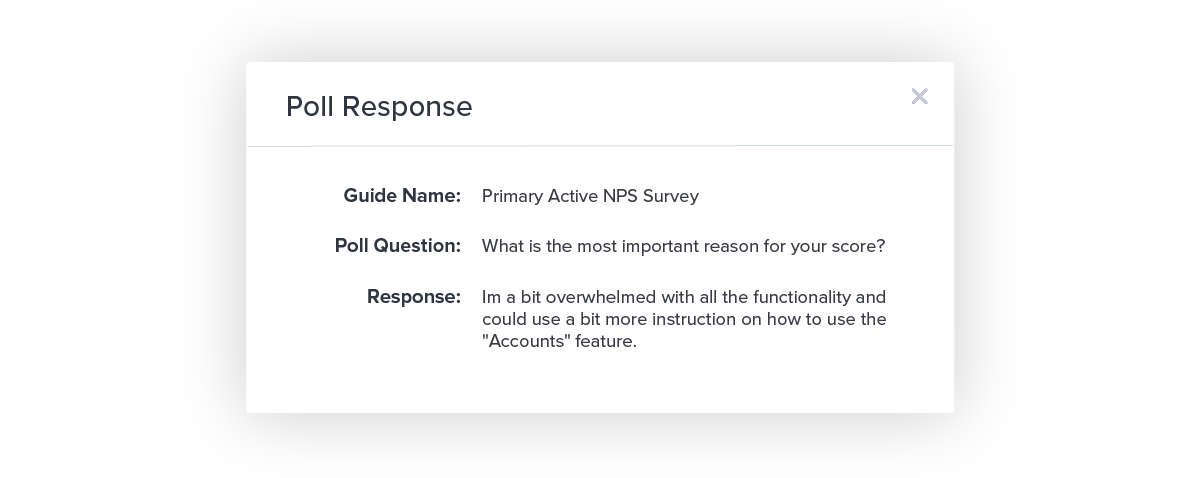
Finally, NPS can not only be an indicator of whether your onboarding experience leads to happier customers, but it can also be a great way to inform improvements to your onboarding. Pendo allows you to analyze your NPS score over time. You can filter NPS based on whether a user completed an onboarding flow or not, and you can also monitor NPS over time to see general trends in NPS after implementing a new onboarding walkthrough.
Finally, comments can be used to gauge where there’s room for improvement and how you can better support users throughout their initial 90 days in your application.
Onboard for outcomes
Measuring onboarding relies on having a complete sense of the behavior and business outcomes you’re trying to drive — and having data available to tell you what’s working and what’s not. These metrics can be used to easily test different guides prior to broader deployment. They can also help flag where onboarding may not be working and allow you to leverage data to create a more impactful onboarding experience.
We’ve collected some of the most effective onboarding walkthroughs from our customers. Click here to gain some inspiration from Pendo customers.