Table of Contents
In a rush?
Download the PDF for later
“NPS Everything” proclaims Bessemer’s 2017 State of the Cloud Report1 when discussing some of the top trends for the SaaS space. Cloud software companies, and businesses of all types are increasingly relying on the Net Promoter Scores as a key indicator of their customer satisfaction and growth potential. Over two-thirds of Fortune 1000 companies currently use NPS in one form or another as part of their customer feedback programs2.
Yet many companies are still trying to figure out the best way to capture a reliable NPS measurement, and most importantly what to do once they have that measurement. The best metrics in the world don’t provide much value if they cannot be made actionable. Although NPS includes its own ‘closed loop’ follow-up methodology there are a number of ways that SaaS companies can use NPS data to provide deeper insights into their customers and their products.
This guide covers NPS basics, how SaaS companies can effectively collect rolling NPS data, and best practices for deriving actionable insights from that data.
The Basics: What is NPS?
Net Promoter Score, or NPS as it is known, is a simple one (sometimes two) question customer satisfaction survey that was developed jointly by Fred Reichheld, Bain & Company, and Satmetrix. An NPS survey asks respondents to rate whether they would recommend a product or service to friends or coworkers on an 11-point scale from 0 to 10.
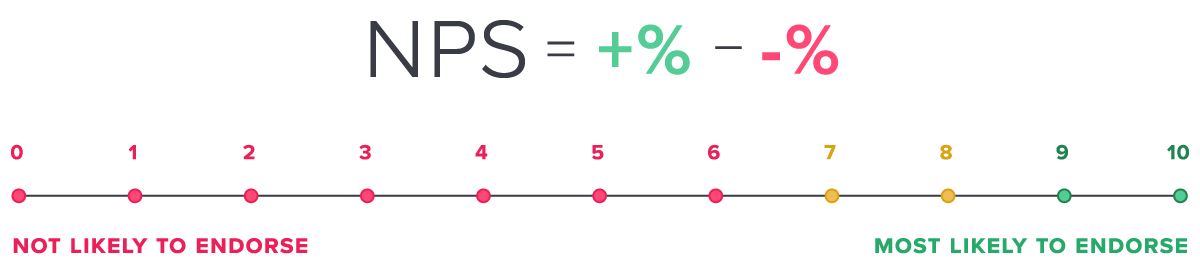
The responses are segmented into detractors (scores of 0 to 6), passives (scores of 7 – 8), and promoters (scores of 9 – 10). An overall NPS score is calculated by subtracting the percentage of detractors from the percentage of promoters to return a single numerical score from -100 (everyone is a detractor) to 100 (everyone is a promoter).
Why NPS?
NPS has grown in popularity for two important reasons. The first is that it provides a clear quantitative measurement — a score — of something that is traditionally very hard to measure. Customer satisfaction is tremendously important to measure. It is a leading indicator for all sorts of financial outcomes. However, it is fundamentally a qualitative measurement that is captured in lots of different ways. This can lead to difficulty in benchmarking — either against an industry or even within an organization. NPS provides a simple, consistent methodology that is widely adopted for quantifying customer sentiment. The measurement is easily understood, and easily benchmarked to track performance over time.
The second reason for NPS’s popularity is its power as an indicator of future growth. The single question posed in the NPS survey: “Would you recommend…” captures not just positive sentiment, but evangelism. A company’s promoters aren’t just happy, but are also willing to spread the word about a particular product or service. The more evangelists a product has, the more likely it is to grow. Therefore, the NPS score in theory not only indicates the likelihood of customer retention, but also the likelihood of customer growth. In practice, the correlation between NPS score and growth has not been fully proven, but the idea has already driven significant adoption. NPS is now a major metric used across product teams and customer success teams and is a fixture of many board presentations.
Delivering NPS
Ok, so NPS is a good, simple metric that all product teams should capture. That’s simple enough. However, there are some challenges and questions that can arise when beginning an NPS program. Questions such as “Which users should I target? Should I survey my user base all at once? How should I collect feedback? How often should I run surveys?” The answers to these questions can have a significant impact not only on your response rate, but on the scores themselves.
Practice 1: Be Thoughtful in Your Targeting
In their eagerness to get started measuring NPS, many organizations begin by running a survey against their entire user base. This can lead to some issues — the first one being primarily logistical. One of the key tenets of NPS is to “close the loop”, or follow-up with users after they give you a score. This is an especially important practice with detractors. If you’ve launched a survey against your entire user base, will your team have the time and bandwidth to follow-up on all of the responses?
Second is the fact that launching a survey to all users doesn’t take into account how long they’ve been customers, or if they are active users of the product at all. There are situations where you may not want to run surveys against your newest users, or you may want to filter out users after a specific period of inactivity as they could sway your scores and prevent you from capturing a clear measurement of your core users.
A good approach is to carefully think through which users you want to measure, and what their key characteristics are. Use this information to define the core segments, and then pull a rolling sample of those users to survey over time. So for example, you might want to only survey users who are paying customers who have been using your product for more than a week. There is no specific best practice for which users to survey: it’s about understanding who you want to reach, and getting feedback that is actionable for your company.
Sampling your user base (rather than surveying everyone) ensures that your team will have enough bandwidth to follow-up with respondents, and that you will be able to do continuous measurement over time. Your service will naturally have some events that affect the customer experience – whether that’s a feature rollout, a maintenance outage, or a customer success meeting. These events can have a significant influence on the NPS scores that you receive during that time. By measuring a rolling subset of users you can smooth out some of these variations.
Practice 2: Use a Consistent Delivery Method
There are a number of ways to collect NPS survey responses. The most common method is via email, but a number of software companies survey customers within their products, while still others use phone outreach to collect NPS scores from customers (usually via a research agency). There are pros and cons to each approach. Surveying users in the application ensures you reach active users while they’re “in the moment” which leads to higher response rates. However, some companies may want to capture input from decision-makers or executive leaders who don’t specifically use the product. Phone calls allow for immediate follow-up, and agency partners can often provide industry benchmarking along with your results, but respondents may be more reticent to give honest feedback.
Obviously different collection methods can have a significant impact on response rates. Companies who move from email to in-application collection see a jump from 2x to as much as 10x. What may not be as obvious is that the delivery methods can also have a significant impact on the scores you receive. Email may bias responses towards your most motivated (positively and negatively) customers, while customers may be less likely to share negative feedback to a live person on the phone. Even subtle changes can make an impact. In once instance, simply changing the survey from one type of modal in the product (banner to lightbox) caused a 78% change in the score3.
All of the variability means that in order to capture an NPS score that you can benchmark over time, it’s important to stick with a consistent methodology as much as possible. A program that moves back and forth between email and in-app survey collection will introduce variability that can’t be attributed to changes in customer sentiment, or improvements in service delivery. Some experimentation is necessary to determine that you’re getting the right volume of responses from the right customer segments, but consistency in your survey collection is a clear best practice.
Practice 3: Consider more focused NPS surveys for specific activities or product features
Typically NPS is used across an entire company or product line to measure overall customer satisfaction, but that is not the only way the surveys can be used. Sometimes it can be helpful to collect more granular NPS scores — either about specific areas of your product, or distinct engagements. For example, you could launch a separate NPS survey targeted only to users of a specific feature as a way to get quantifiable feedback around the feature. Using a methodology like NPS allows you to consistently benchmark satisfaction for different features within your product. Another potential use is to issue NPS follow-ups for service engagements or support issues.
Smaller-scale NPS surveys like this can help provide clear insight into different specifics of your product and company. As with all surveys, you’ll want to exercise caution when targeting to ensure that you aren’t requesting feedback too frequently from the same users. If you do deploy some of these smaller scale surveys, consider removing the respondents from any overall, or larger-scale NPS initiative for a period of time. Survey fatigue can lead to less valuable responses and may even lower the customer satisfaction that you’re trying to capture and improve.
Congratulations! You’ve Got a Score. Now What?
At this point it’s good to remember that the NPS measurement is only the beginning. Your score is an opportunity to reach out to your customers to create meaningful engagement and improvement in their experience. If your broader organization isn’t fully aligned around NPS as a system for customer understanding and engagement, your efforts to survey and collect the score in the first place will not yield significant value.
Practice 4: Share Your Results Broadly
NPS initiatives are successful when an organization is united around the process. It’s difficult to effectively run NPS within a single department as both the input captured and the follow-up are important to multiple teams within the organization. The product team needs to understand how the customer experience they deliver in the product affects customer sentiment. The customer success team wants to know who their unhappy customers in need of intervention are. The marketing team wants to know who their potential champions are. When everyone is engaged, the value of the program grows significantly.
Ideally, organizations should look to build consensus and buy-in around a program prior to launching a single survey. However, sometimes initial results are needed to really drive awareness and interest in the program. Regardless of who initiates NPS, a best practice is to share the results broadly. The customer success team at Trendkite used a large monitor in their office to showcase a running tally of their score as responses came in4. The product team at Invoca pushed their responses into a company-wide Slack channel5. In both cases the public displays helped to galvanize broader organizational interest and support in the initiatives.
Practice 5: Really Close the Loop
The NPS methodology includes the idea of a closed loop system. This means that the survey is only the first touch in a multi-step engagement with the customer. After receiving the score, you should be following up with the customer to understand their reasons behind the score, and re-engaging them after a period of time to measure changes in their experience or feedback. The reality of many NPS implementations is that surveys are pushed out and responses are collected, but only a small percentage of customers receive follow-up.
To avoid this, consider putting a detailed follow-up plan in place prior to survey rollout with owners for each step of the process. Remember that your support or customer success teams aren’t the only ones who can do follow-up. Look to distribute that responsibility. For example, you may want to have your marketing team handle follow-up with promoters — those who give a score of 9 or 10. These are customers who are advocates, and potential references. Marketing would probably like to speak with them anyway. Product and UX teams should also get involved — especially when usability issues or product shortcomings are cited in the survey feedback.
Even with the best plans, sometimes your organization simply doesn’t have the bandwidth to follow-up on all of the responses you receive. If you must triage your follow-up, look to connect with all of your detractors, and then, follow-up with those that take the time to provide additional feedback in the second part of the survey. These people likely have the strongest opinions (both positive and negative), and as a result will give you the most valuable feedback. In future surveys, consider reducing your sample size so that you won’t have so many responses to follow-up on afterwards.
Practice 6: Segment Your Responses
When running NPS surveys it’s common to look at individual responses and, of course, to look at the overall score. What’s missed, sometimes, is to calculate NPS for specific customers or customer segments. Rolling up the NPS responses for the different segments can sometimes yield important insights that would otherwise get lost in the larger summary.
One area to look at is different user roles. Often in enterprise software you will have different user roles using different parts of the software. Their experiences, and thus the feedback they give you can be quite different. Looking at different roles can help you understand which segments are being underserved in your product, and provide a quick win to push up your NPS score. Henry Schein, a provider of dental practice software, was able to uncover some significant variation in their NPS responses when they compared the scores they were receiving from practice owners to those from office managers. The discrepancy helped them identify some key areas of the product to improve6.
Another segment to look at is different time-based cohorts. Feedback from early users can help to shape your onboarding experience. Much of what they are reacting to is the initial experience in the product. Scores from users who have been in the product a long time can speak to the ongoing value that your product delivers. If you’re seeing variance between different cohorts, there may be clues in customer behavior in the product. Are there features and tasks that long-term users have mastered that drive higher satisfaction? And could those be worked back into the onboarding content to make users satisfied more quickly? Opportunities such as this can be uncovered through cohort analysis.
The last area to consider is segmenting NPS responses by individual customers. Large enterprise SaaS deployments can have hundreds of users in a single customer. Looking at NPS scores rolled up to the company level provides an important customer health metric, and is a leading indicator of churn. It can also provide some clues about implementations and use cases that get the most value out of your product.
Benchmarking Your NPS Results
A natural inclination for any company, once they have an initial NPS score is to benchmark themselves. NPS ranges tend to vary quite a bit by industry, so a broad comparison is of little value. There are a number of sites where you can find a rough range of NPS scores broken down by different industries that can serve as a basic comparison for your score.
Within the software industry scores can vary depending on the type of software. Zendesk’s benchmark report found that consumer software had an average NPS score of 32, while business software was a few points lower at 297. Across the software industry, scores of 50 or higher are considered exceptional.
Practice 7: Benchmark Against Yourself
As this paper has discussed, there are a lot of factors that can have significant impacts on NPS. Everything from user segmentation, to how often the survey is collected, to even how the survey is presented in the app can have a significant impact on scores. With all this variation, even an industry-specific benchmark is not a perfect point of comparison. A better approach with NPS is to benchmark against yourself.
Once you’ve established a consistent methodology, and are happy with the responses you are collecting, then you can begin to track scores over time. Look to run your survey consistently — either monthly or quarterly across a rolling sample of users, and see how the score fluctuates over time. With effective follow-up in place, and thorough analysis of the results you should be able to move your baseline score higher. Ultimately this success is more meaningful to your business and your customers than a rough industry comparison.
This doesn’t mean that you should ignore benchmarks overall. With NPS, as with all other measures, it’s important to compare your results to your peers whenever possible. However, tracking your NPS trends (either positive or negative) is very valuable and immediately actionable.
NPS and Product Usage
One of the key areas of analysis for NPS is to look at NPS along with product usage data. Unlike other industries, SaaS vendors have an almost unlimited ability to measure user activity within their products. Comparing this detailed usage data alongside NPS responses can help to identify which areas of your product drive the highest levels of user satisfaction, and find specific customers where immediate outreach can have the most significant impact.
Practice 8: Analyze Specific Feature Usage for Promoters and Detractors
In the same way that segmentation can yield additional insights about your score, specific feature usage can be even more insightful. Looking at which features are used by different NPS respondents, and how often they are used, can tell you a lot about how users realize value. Features that are used heavily by your promoters are likely ones that provide significant value — especially if your neutrals and passives don’t use that feature as actively. If you identify something like this, then an easy way to improve customer satisfaction is simply to begin promoting those features heavily to users who give you poor NPS ratings.
Another measure to look at is how much time users spend in particular areas of your product, or the amount of time it takes for them to complete a task. Areas where you see discrepancies in time between detractors and promoters can point to specific usability issues — happy users easily (therefore more quickly) complete a task, while unhappy users struggle. Places like this can be an opportunity to provide additional help to certain segments of users. In analyzing NPS with product usage, Trendkite found a strong correlation between time to complete their onboarding process and customer satisfaction. Users that got through onboarding more quickly were more satisfied over time. With this data they were able to focus on reducing friction in the onboarding process for all of their users.
Practice 9: Compare NPS with Adoption Levels To Identify Key Customer Segments
Looking at overall usage by NPS score can be very helpful and also allow you to identify specific groups of users to engage with. The best way to think about this analysis is a basic graph setup — showing NPS score on one axis, and product adoption (i.e. overall feature usage) on the other.
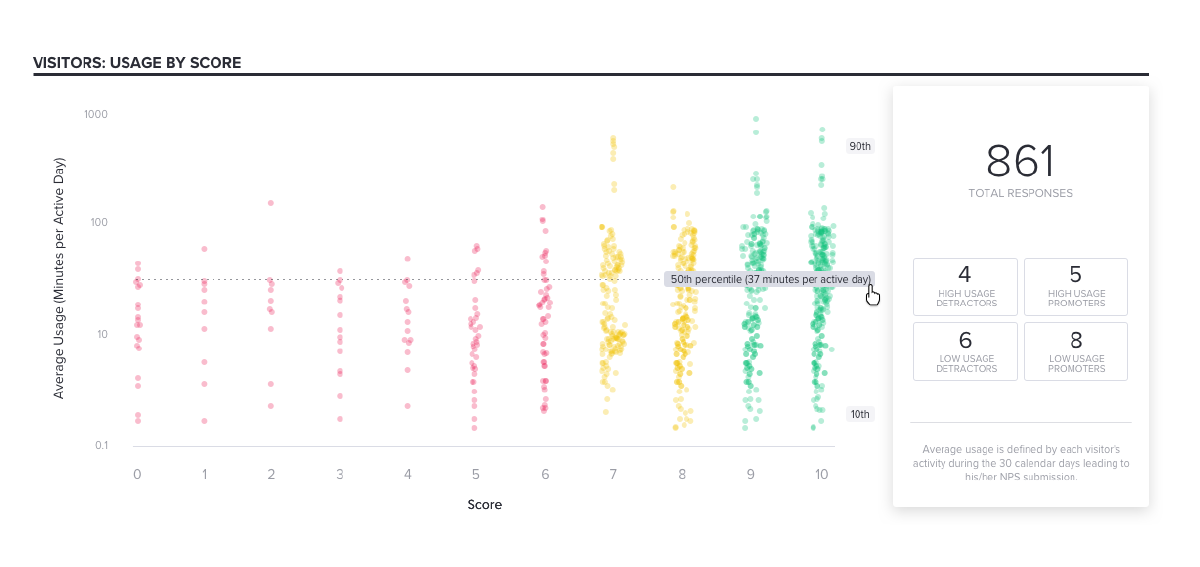
The edge of each quadrant contains a specific group of users that may be extremely actionable — meaning you could get a lot of return by engaging these customers directly. Consider, for example, the group of users in the upper right-hand side. These users are both promoters and some of the highest users of the product. These are ideal reference customers, as they can not only provide a testimonial, but have likely realized specific benefits from your product that they are willing to share.
Conversely, the other side of the graph shows users who are both detractors and very infrequent users of your product. This is another group ripe for intervention. With the right engagement, you may be able to increase usage across this group — pointing them to the features and areas of the product that are used by your most satisfied users. If you can get these users to increase usage, you will likely increase the value they perceive, and ultimately their NPS score.
The ROI of NPS Improvement
It would seem self-evident that increasing customer satisfaction is something that any business would want — especially one dependent on recurring revenue like the SaaS space. Yet, at the same time it’s not always intuitively easy to make the jump from customer satisfaction to ROI for any investment in NPS. Make no mistake, NPS is definitely an investment. Whether you’re buying tools to collect survey responses and calculate scores, or simply counting the time that goes into implementing the survey and following up with respondents, there is a cost attached to any NPS program.
Practice 10: Build a Business Case for Your NPS Program
As with all other investments an NPS program needs a clear and compelling business case. This will help you quantify the potential return and make it easier to increase cross-departmental buy-in that is needed for a full-fledged follow-up effort. While the growth-predicting power of NPS can be debated, it’s still possible to put together a strong investment case by looking at the impact of satisfaction on customer lifetime value (LTV).
In SaaS, as with all subscription-based businesses, LTV is an important metric because the value of any customer is contingent on how long they continue to use your software. As part of your segmentation analysis of NPS results, look for differences in average lifetime value between different NPS segments. Typically, you will see some correlation between the length of time a customer sticks around and their satisfaction level.
So, using a simple example, let’s say your product has an average annual recurring revenue (ARR) of $10,000, and that on average detractors stay on for 18 months, passives stay for 24, and promoters stay on for 36 months. That means that every new passive is worth $5,000 and every new promoter is worth between $10,000 and $15,000. So a program that generates 20 new promoters could see a return of as much as $300,000 in revenue. Comparing this potential return to the investment needed to generate new promoters can provide a clear ROI justification for the program.
Other areas where NPS initiatives can lead to specific ROI are in customer support and development costs. Feedback from NPS surveys can help you identify which features drive the greatest user satisfaction, and which ones cause users to struggle. This information can help to shape development priorities and focus usability improvements to streamline the product experience. You’re no longer spending development hours on features that don’t add user value, and the usability improvements should result in a measurable reduction in the number of support requests you receive. These savings can help to quantify your NPS business case.
Demystifying NPS
Net Promoter surveys aren’t overly complex. It is a single question asked to a subset of your customers that hopefully provides a clear, comparable benchmark of their satisfaction. Yet, with all the variation in how responses can be collected, analyzed, and followed-up with, implementing an NPS initiative can seem daunting. It doesn’t need to be.
With some experimentation, you should be able to find a survey approach and targeting strategy that works for you and your customers. Use the initial surveys to develop a baseline that you can then benchmark against over time. Remember that your NPS responses are a valuable data resource. Segment your responses to find potential groups of users who are currently underserved by your product, and compare your NPS scores with product usage to identify the parts of your product that drive the greatest user satisfaction. With these best practices in place you can look forward to a successful and valuable NPS program.