Why measurement can’t live in a vacuum: Introducing product performance benchmarks
Measurement is ingrained in a product person’s job. From product engagement, to customer feedback, to NPS — data is more available to a product manager than ever before. As a result, PMs are expected to quantify the product experience.
But as much as the ability (and urgency) to measure product performance has become commonplace, knowing your product’s relative performance remains out of reach. After all, even if someone knows, say, their app retention score, are they likely to share it? And is it even reasonable to compare yours to theirs?
Comparison may be the thief of joy, or it might be the key to you getting the recognition you deserve.
Of the many KPIs you could be measuring, I believe four numbers are crucial to understanding your product’s performance: stickiness, feature adoption, app retention, and account-level NPS. And now, we’re giving you the opportunity to see how your product compares to your peers for each of these four metrics.
We analyzed over 1,000 digital products to establish product performance benchmarks, including low (25th percentile), average (50th percentile), good (75 percentile), and best-in-class (90th percentile) performance. These product benchmarks also include three different segments based on company size: start-up (0-200 employees), scale-up (201-2,500 employees), and enterprise (2,501+ employees).
If you’re already eager to see how your product performance stacks up (I know I would be), check out the full version here. Otherwise, here are a few of the results that I found the most compelling:
Feature adoption: more features, more value
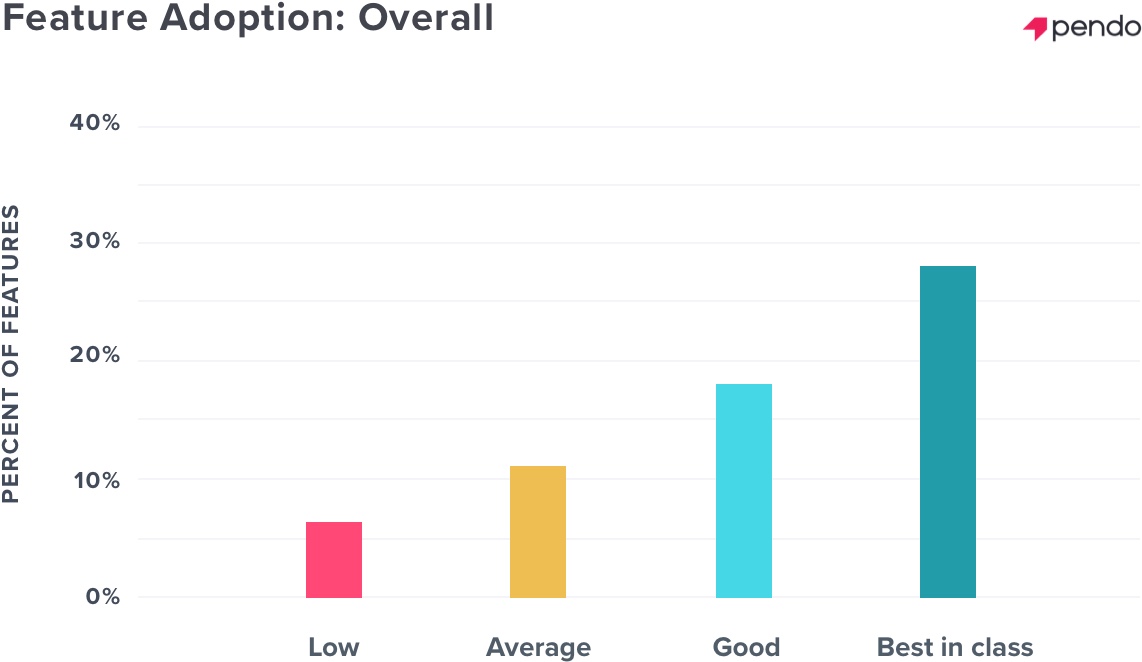
Feature adoption is an extremely important metric for predicting customer churn. Think about it: the more features a user adopts, the more value they receive, and the less likely they are to abandon your product. For our purposes, feature adoption measures the percent of features that generate 80% of click volume.
When you look at all segments, the feature adoption benchmarks are pretty standard, increasing slightly as you move between percentiles: 7% (low), 11% (average), 18% (good), and 28% (best in class).
When you take a look at feature adoption for different company sizes, it’s a little bit more of the same. What does this tell us? Although it’s natural to assume that larger, more established enterprise companies would surpass scrappy startups in every category, when it comes to feature adoption, it’s more of a level playing field.
App retention: are your users sticking around?
Knowing how many users you have at any given point is one thing, and hopefully something you’re proud of. But knowing how many users continue to use your product over time — that’s when you can begin to understand if the experience you’re creating is keeping users engaged and if (and when) there are drop-offs.
In this case, we measure app retention as the percentage of users who return to the product in the first three months of usage. In general, the number of users drops significantly in the first month, and then decreases steadily — by around ten percent — between month one and month three, for all four percentiles. This feels intuitive, since over time your product will have some natural attrition.
Things get a little more interesting when you examine the different company sizes.
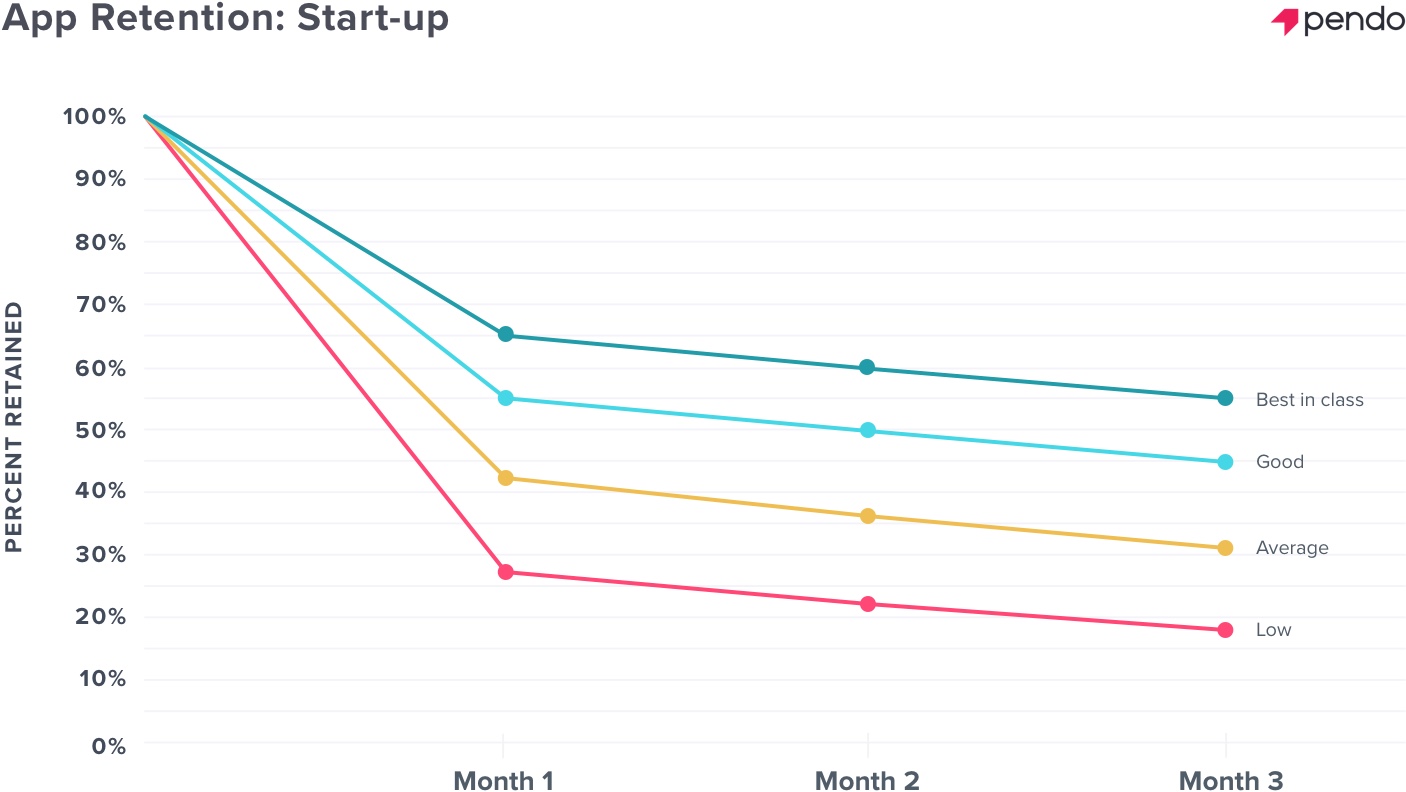
As you move from the start-up segment to the scale-up segment, the difference between average and good app retention widens in month two, and then re-calibrates by the end of the third month.
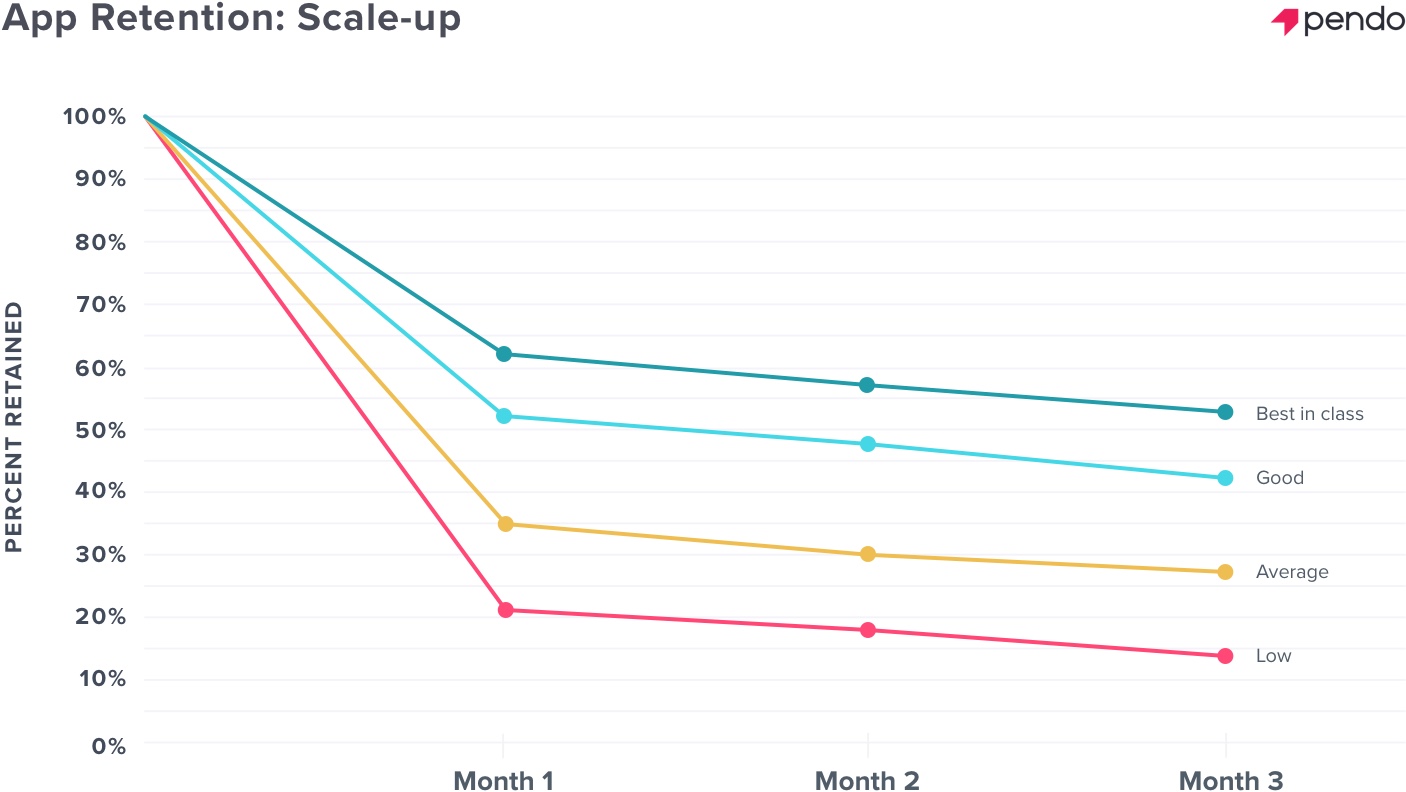
For enterprise companies on the other hand, the biggest difference lies between good and best in class app retention. This could indicate that as companies scale, the expectations on the product are heightened as well, and enterprise organizations are rising to the occasion.
See how your own product stacks up
If you want to dig deeper into all five of the product performance benchmarks, check them out here. You’ll also be able to download a set of custom slides that you can use to showcase your own product’s performance against the benchmarks.