A COMPREHENSIVE GUIDE TO
Product analytics
A category of business intelligence software that captures and exposes usage patterns from digital products via event tracking, event properties, and event and property grouping.
Last updated: March 13, 2024
Dive deeper
Table of Contents
What is product analytics?
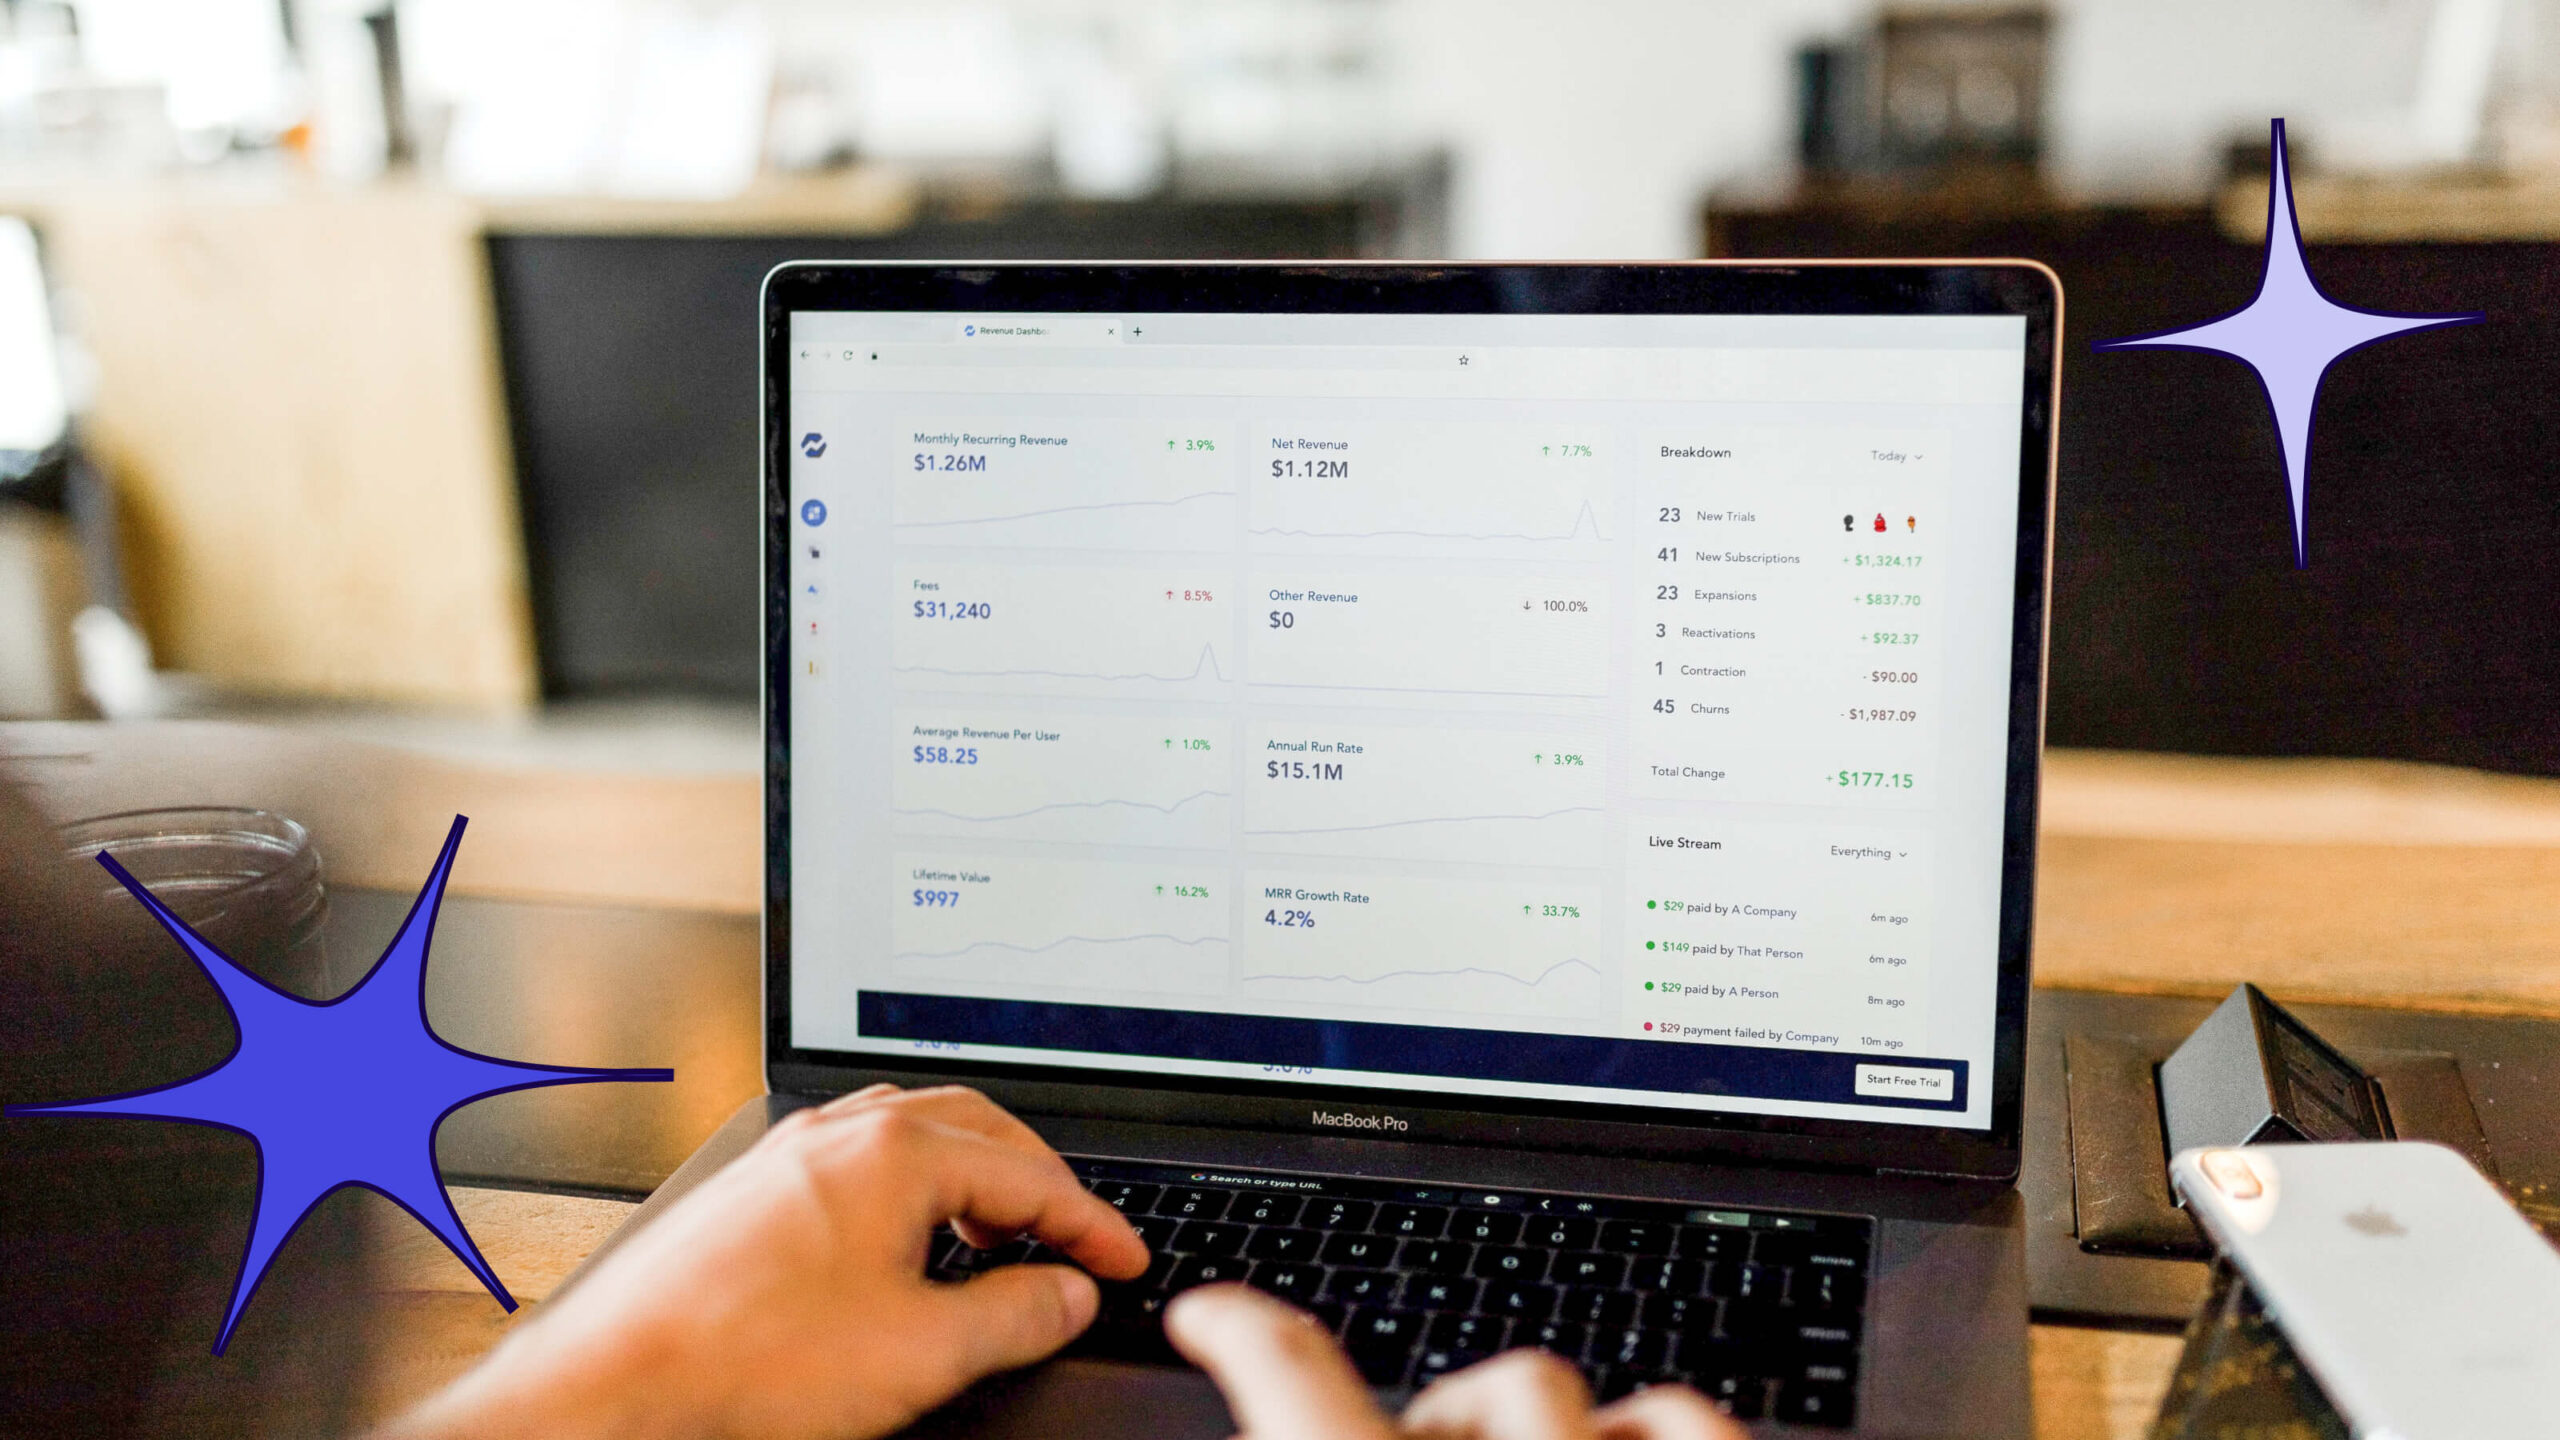
Product analytics is a type of business intelligence software that captures and exposes usage patterns from digital products like web and mobile applications via event tracking, event properties, and event and property grouping. This data informs decisions about how to improve the product experience, increase product engagement, and drive business outcomes. Usage data tends to be more reliable than user surveys and product testing alone.
Why is product analytics important?
Today’s companies must adopt a digital-first mindset in order to best serve their customers (and make sure they stick around). Software users expect tools that are seamless, intuitive, and delightful–no matter if they’re using an application in their personal life or at work. For businesses tasked with delivering on those expectations, improving one’s digital product starts with understanding how users are engaging with it. Product analytics provides a foundational layer of data that companies can use to measure and optimize their users’ experience.
Who uses product analytics?
Product managers, user experience (UX) designers, and growth strategists rely on product analytics (sometimes called “click tracking” or “click path analytics”) to track digital interactions within their apps, websites, and devices. HR and IT managers also rely on analytics to gauge how effective their employee onboarding programs are, strategize ways to improve productivity, and ensure compliance in key areas such as security.
What tools does this provide?
The way the data is grouped and queried plays a major role in how useful product analytics are to the product manager, UX designer, or growth strategist. The same is true for employee-facing roles, be they in HR, change management, or information security. Some of the most common ways to understand product usage include:
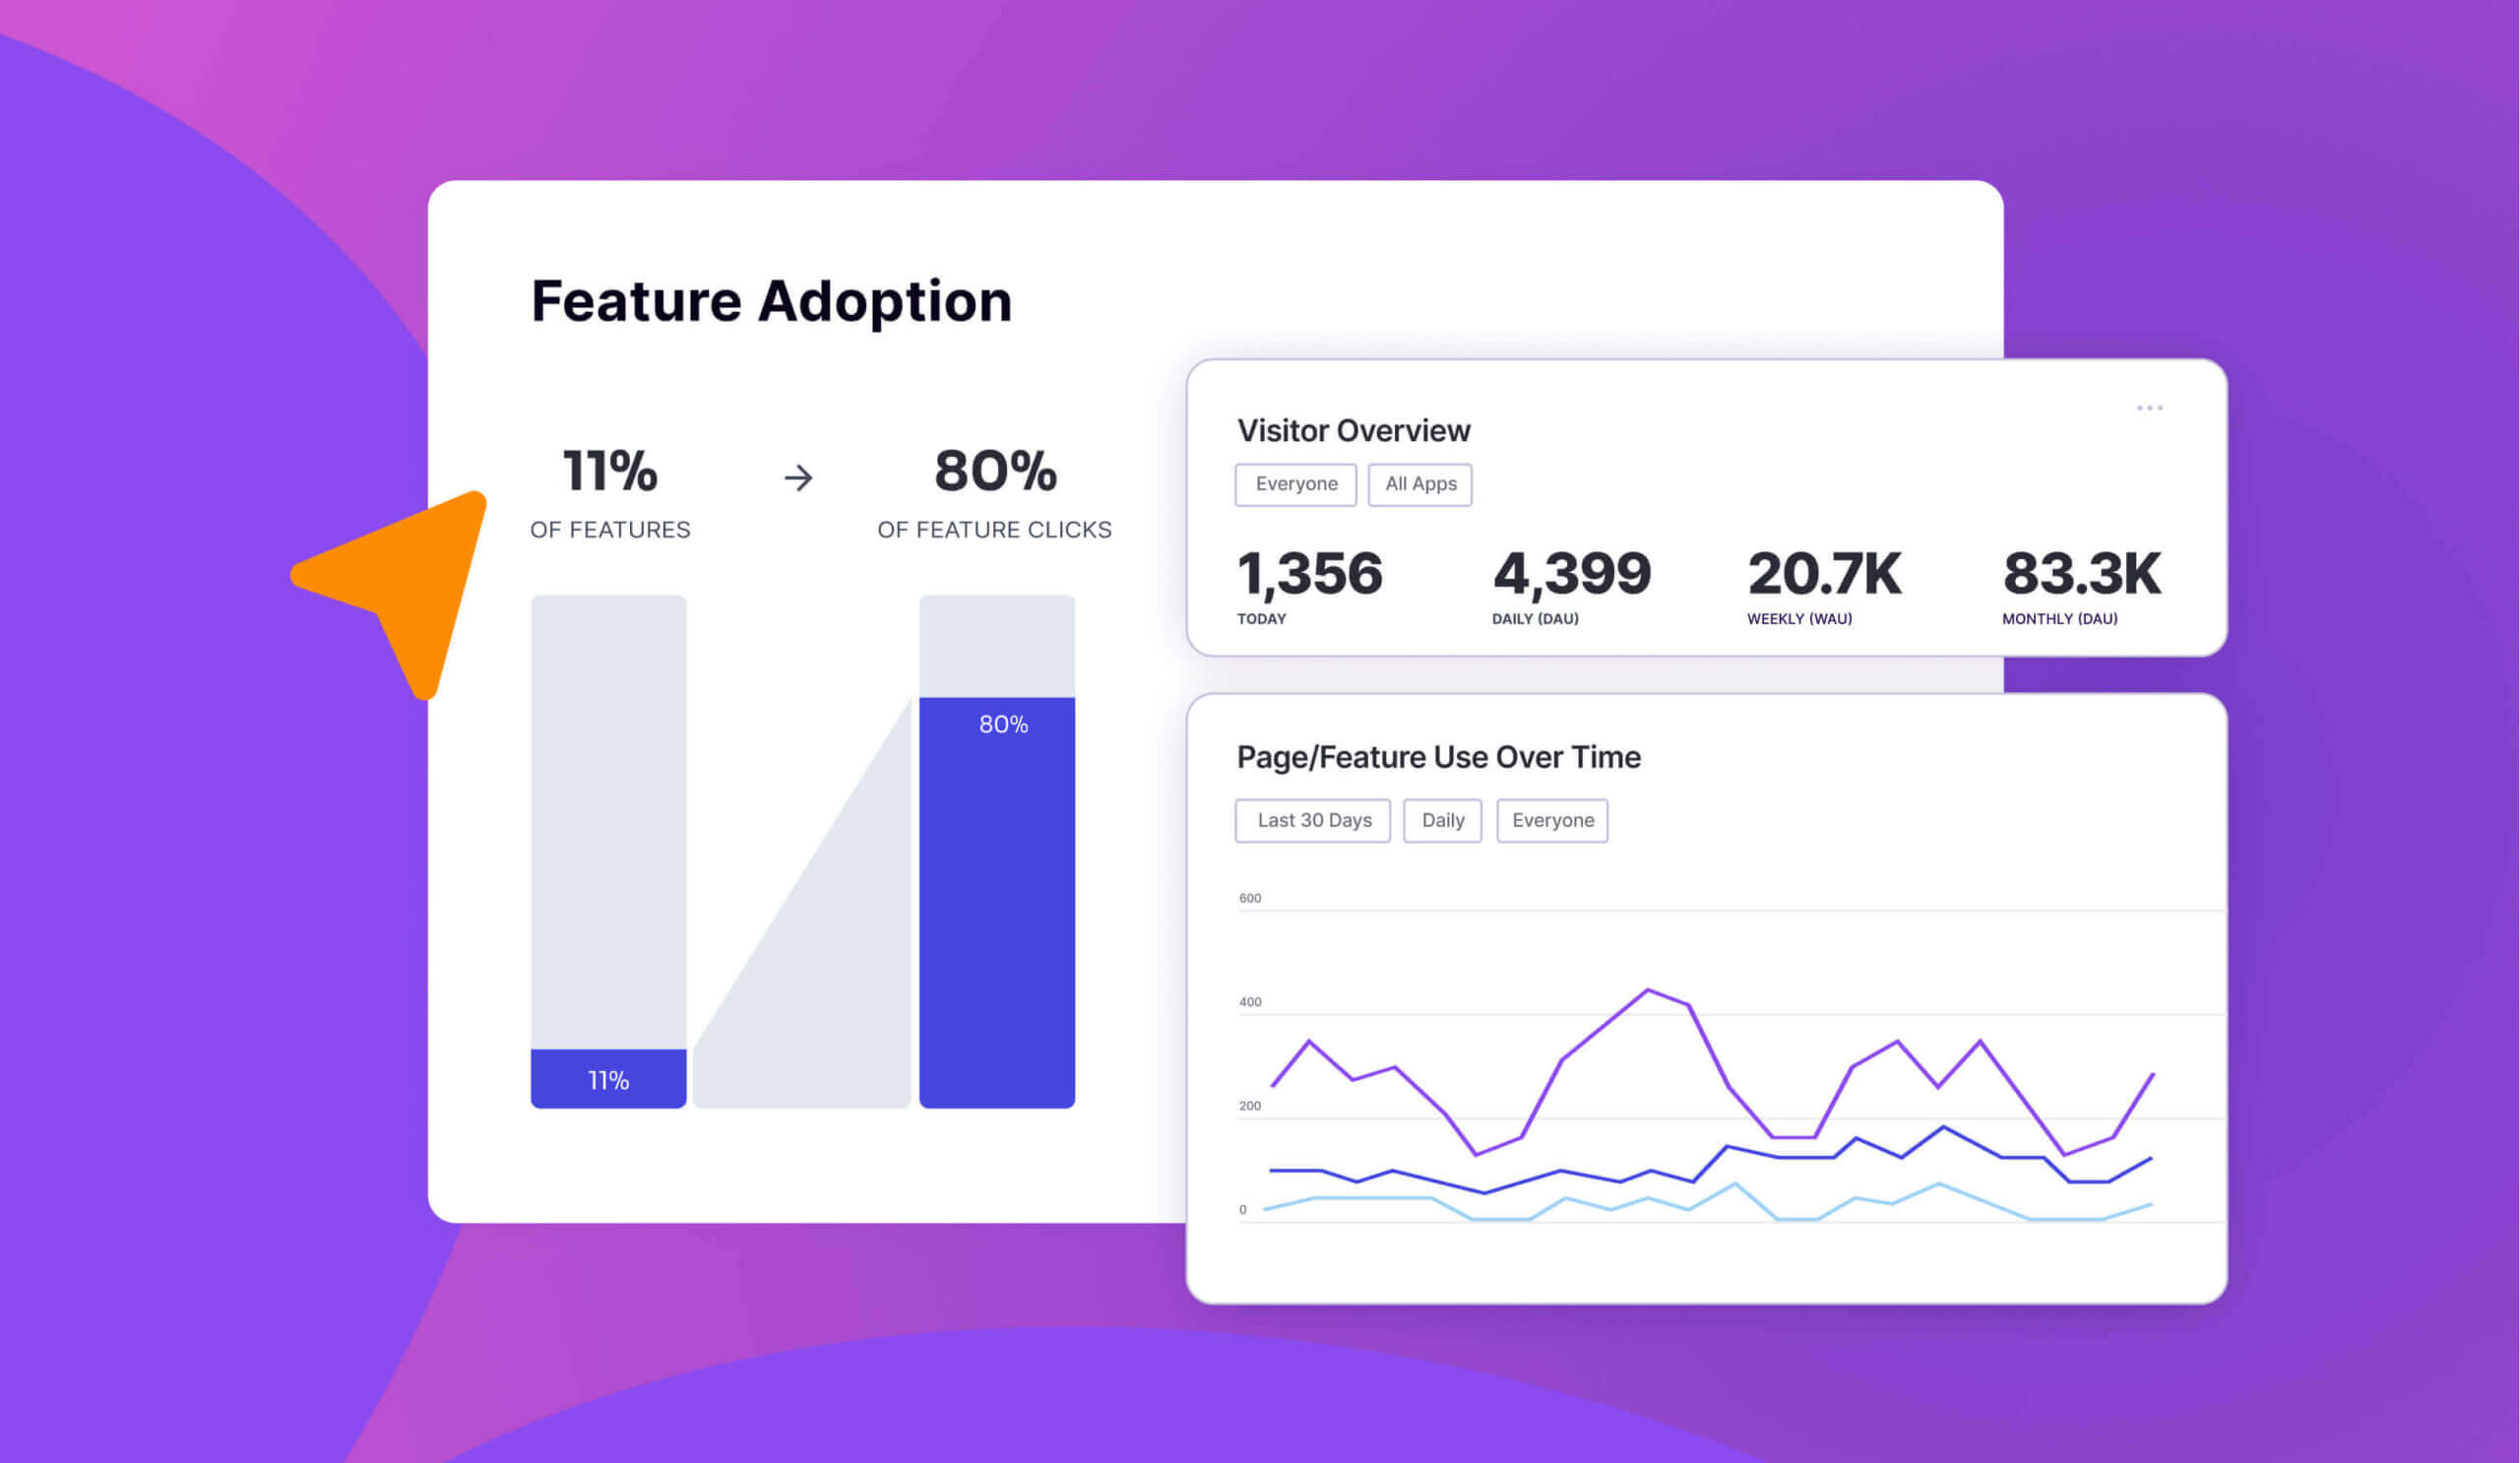
- Trends: Graph engagement with certain features or pages and compare against other parts of the product over time, or compare engagement with a single part of the product over two different time periods.
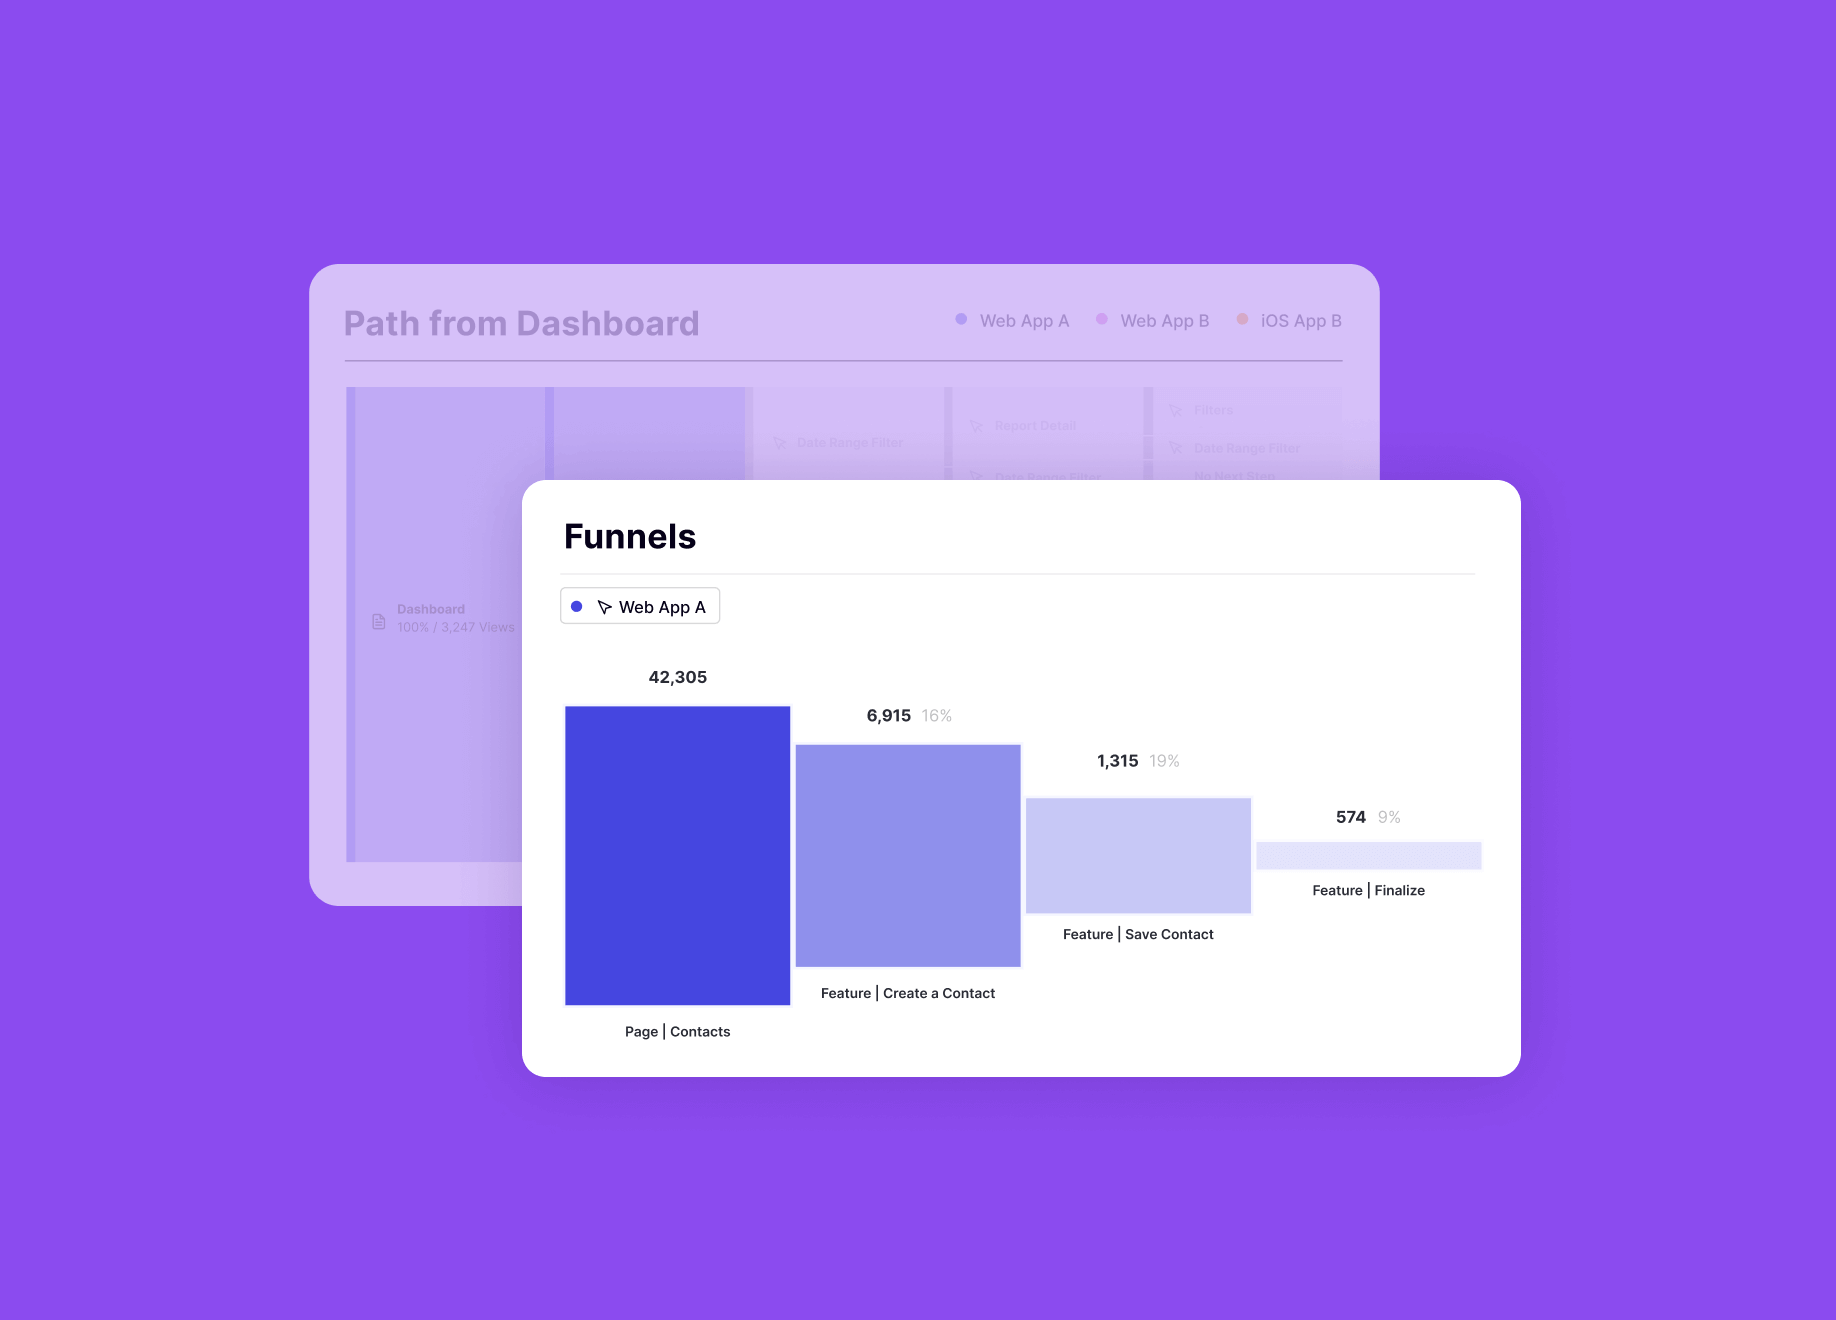
- Funnels: Track the levels of drop-off at each step across a specific subset of features and pages in the product. With a funnel analysis, any combination of steps can be reviewed in any chronology.
- Paths: See all the product journeys users take either leading up to or following a specific interaction, with a measure of how common or uncommon the next step being taken is. Unlike funnels, paths include all possible upstream or downstream interaction scenarios.
Why should I use this?
User insights and ROI
Until recently, product decisions were evaluated by whether or not a feature launched on time. Product analytics allows product and UX teams to better understand the effectiveness of their strategies or user engagement and their return on investment (ROI). The data that comes from tracking in-app events helps product teams learn what parts of the product are being used, how often, and by whom, as well as the product experience paths that lead to the outcomes that matter most.
At IHS Markit, the team uses product analytics to pinpoint which features get little to no use, so they can retire them and reduce technical debt. Data from their product analytics system also helps them understand which users were accessing those features, so they can connect with them directly to find a new workflow to achieve a similar outcome.
Growth and experimentation
Product analytics unlocks the metrics by which hypotheses are made and meaningful engagement is measured: adoption by monthly active users (MAU), adoption by daily active users (DAU), stickiness by return rate over time, breadth across features or products, depth across users in a specific cohort or account, and how they relate to business metrics. With product analytics, product managers, UX designers, growth strategists, and change managers can observe a challenge or opportunity, develop a plan, deploy the change, measure outcomes, and iterate with minimal latency or dependencies.
Successful digital transformation
A successful digital adoption strategy incorporates product analytics into its gameplan. Robust analytics not only help managers see how well employees are, for example, using a new product feature. They also let teams analyze existing workflows and employee behavior within and across software to help inform decisions about future app purchases and recommended best practices. By making sure a digital adoption plan fits with a company’s culture and habits, managers thereby make it more likely that it ends in success.
How is product analytics used?
For product managers, UX designers, and change managers alike, the application of product analytics starts with a question to answer. Examples of common questions that can be answered by product analytics include:
- How would a change to the experience affect engagement?
- Which features should we retire to improve outcomes?
- What combination of interactions contribute most to conversion?
- Why are certain products in my portfolio stickier than others?
- Where are the biggest frictions and leaks during onboarding?
With product analytics tools, companies can also correlate their product insights with user analytics and other operational metrics to get a clear view of how the product impacts behaviors and leads to key business results such as a reduction in support tickets, increased productivity, and an overall higher ROI on their software.
What type of data does product analytics track?
Product analytics solutions typically track two types of data about user interactions:
- Event Tracking: User actions are commonly called “events.” Events include clicks, slides, gestures (for mobile and other device types), play commands (for audio and video), downloads, page loads, and text field fills. The event includes the type of element, the name of the element, and the action the user took. Generic examples of events include Create Account, Add to List, Submit Feedback, Enter New User, Run Report, Share Dashboard, Select Option, Play Tutorial, Change View, and Complete Onboarding.
- Event Properties: The way one understands the specific attributes of the tracked interactions is the work of event properties. Product managers, UX designers, and growth strategists don’t only care if something happened, but also the context that distinguishes activity from impact when analyzed longitudinally. Event properties can include details like time, duration, count, device, software version, geography, user demographic, account firmographic, element characteristics (like color, size, shape), boolian (like login: yes/no), and custom attributes (like basic/pro/enterprise).
What’s the origin of product analytics?
For today’s product managers, UX designers, and growth strategists, product analytics is the key to building a product roadmap and driving innovation and continuous improvement. Where web properties were historically judged by metrics that revealed little about the relationship between digital products and business objectives—page views and session duration—the modern app-based web and mobile internet is powered by more telling and contextual interactions: events, engagement, and journeys.
The shift toward meaningful insights is particularly relevant in multi-app portfolios—especially across platforms and devices—where tracking and correlating a variety of product data dictate the design, functionality, and experiments that drive product strategy and growth. Companies are now reaping the benefits of product analytics not just for the software they create for customers, but for their employee-facing applications as well.
Why is product analytics important for digital adoption?
Product analytics matters for digital adoption because in order to assess whether employees are getting the most value out of software, managers have to be able to track how they are using it and what, if any, roadblocks they are encountering within and across it. In today’s workplace, different employees have different needs and pain points when it comes to apps. Robust analytics is essential to arriving at the best ways to reduce friction and optimize software experience across a company’s entire team.
How do you implement it?
It’s critical to choose a product analytics solution that can start collecting all of your product’s data automatically and allow you to examine it retroactively. This means you can implement your solution and access the data you need right away as different questions arise, rather than having to tag events and wait as enough data is collected to get answers or take action.
You’ll also want to choose a solution that’s user-friendly, so the data is easily accessible to everyone in your organization, and one that’s easy to install without the help of engineering resources.
Is Google Analytics a good tool for product analytics?
Google Analytics is a powerful tool, but the insights it provides are limited in scope and designed more for web analytics, SEO, and marketing than for true product analytics use cases.
It doesn’t have the capability to truly examine every aspect of the user journey across your apps, and it requires you to tag the events you’re interested in ahead of time, so you can’t examine user behavior retroactively. Google Analytics also can’t segment users based on specific criteria, like their role, company, or how they engage with your platform.
Without those capabilities, it’s difficult to truly know where your product can be improved or optimized.
Why is Pendo the ideal product analytics solution?
Now you have the answer to “what is product analytics” and we have the solution. Pendo’s product analytics capture everything that happens in your product from the moment you install it. The analytics work retroactively from your install date, so you can call up any of that data whenever you need it without having to tag features or events beforehand. And you don’t need any help from engineering to get it set up and start collecting insights—just install a snippet of JavaScript on your app.
Pendo’s Paths, Funnels, Data Explorer, Product Engagement Score, and other features allow you to use the data you collect to discover areas to improve and optimize the customer journey, uncover and fix spots where users encounter friction, and identify cross-sell/upsell opportunities based on user behavior.
Pendo also seamlessly integrates with a wide range of other platforms, including Salesforce, Hubspot, Zendesk, and Slack. Explore our integrations here!
Where can I learn more about product analytics?
For those looking to dig a little deeper into product analytics, there are a number of books on the subject, including “High Growth Handbook” by Elad Gil and “Practical Web Analytics for User Experience” by Michael Beasley. Coursera also offers online courses on digital product management and actionable product analytics. Pendo has published information on how to collect product insights and drive feature adoption. It has also published content on how the right digital adoption solution leverages product analytics and the role product analytics plays in bringing about successful digital transformation.
You might also like